

Financial: The Cascade
The Diagnostic Dozen: A Framework for Reading the Macro Cycle (9 of 12)


Previously in this series: Labor: The Source Code | Prices: The Transmission Belt | Growth: The Second Derivative | Consumer: The Last Domino | Housing: The Collateral Engine | Business: The Forward Commitment | Trade: The Transmission Belt | Government: The Fiscal Overhang
The Fed sets a rate. Markets celebrate or panic. And then everyone moves on to the next meeting. But the rate itself is not the story. The story is what happens between the rate and the real economy. That space, the transmission mechanism, is where financial conditions live. Credit spreads, lending standards, volatility, liquidity, real rates: these are the pipes that carry monetary policy from the Fed’s balance sheet to the factory floor, the mortgage desk, and the credit card statement.
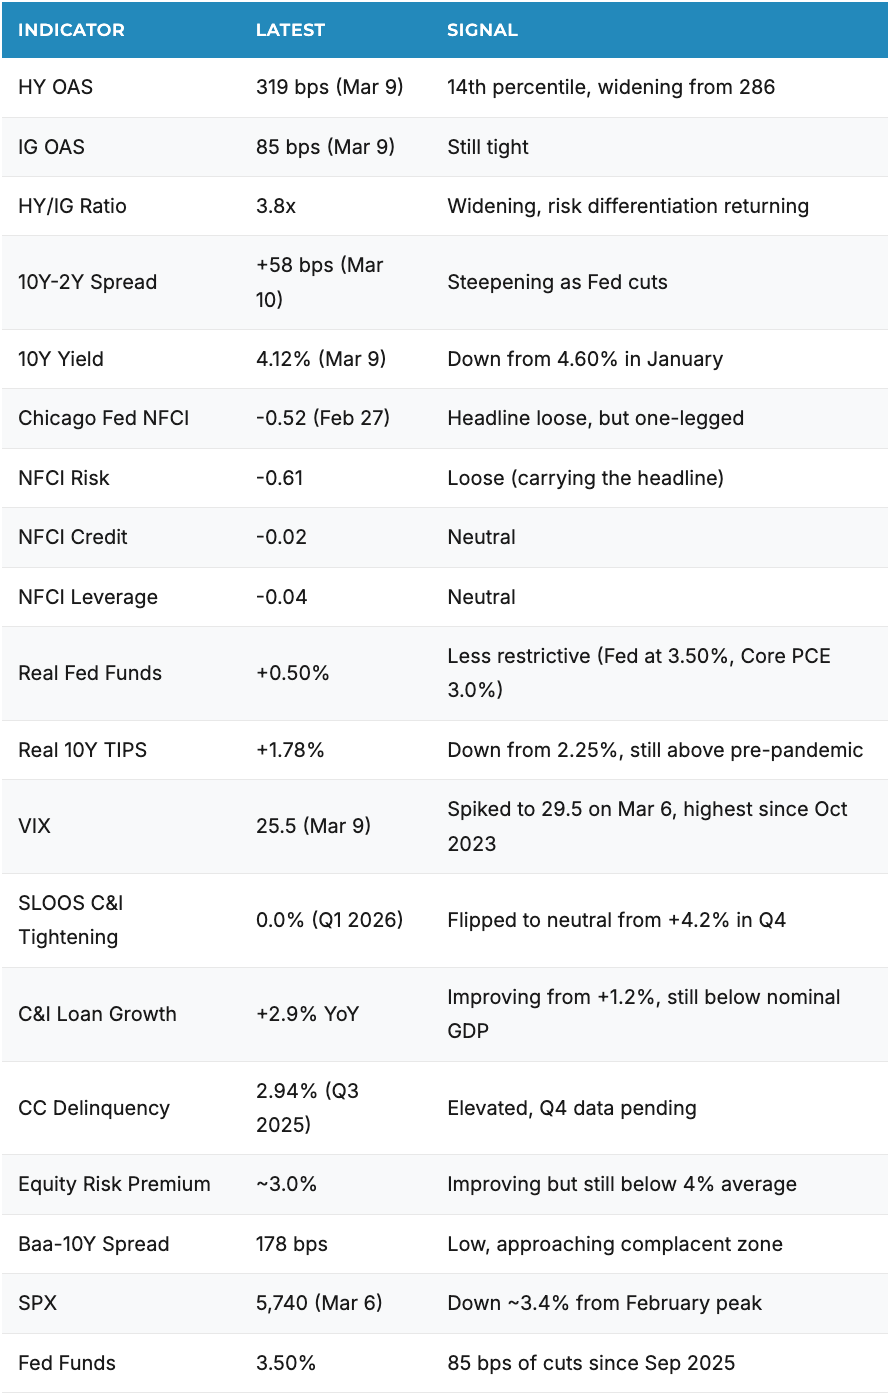
The pipes can amplify. They can dampen. They can clog entirely. The Fed has cut 85 basis points since September 2025, bringing the target to 3.50%. Policy is easing. But the VIX just hit 29.5, HY spreads have widened 30 basis points in three weeks, and equities are selling off. The rate is loosening. The transmission is tightening. That disconnect is the entire story of this pillar.
This is Pillar 9. The second pillar in our Monetary Mechanics engine. Where the price of money meets the availability of credit.
The Core Insight: The Divergence Problem
Financial conditions are not a single number. They are a constellation of signals that, in healthy markets, move together. When the Fed tightens, spreads widen, banks tighten standards, volatility rises, and risk assets reprice. When the Fed eases, the opposite happens. That coherence is how the transmission mechanism is supposed to work.
When the signals diverge, something is about to break.
What we are watching now is a new kind of divergence. Through most of 2025, market-based measures (credit spreads, equity volatility, financial conditions indices) said conditions were loose while credit-channel measures (bank lending standards, loan growth) said conditions were tight. That was the old divergence. Banks were tightening while markets partied. We said the banks would win. They always win.
Now something more interesting is happening. The Fed is cutting. Banks have eased standards (SLOOS flipped to neutral in Q1 2026). But markets are repricing anyway. VIX has surged from 14 in January to 25.5. HY spreads have widened from 286 to 319 basis points. Equities are down from their February highs. The old divergence is resolving, but not cleanly. The easing from the policy channel and the tightening from the market channel are colliding in real time.
What to Watch and Why
We track financial conditions across eight dimensions. Each captures a different layer of the transmission mechanism.
Credit spreads tell you how the market prices default risk. The yield curve tells you about recession probability and term premium. Financial conditions indices synthesize rates, spreads, equities, and the dollar into composite gauges. Bank lending data shows the physical transmission of credit to the real economy. Delinquencies confirm whether the credit deterioration banks see is real. Volatility measures uncertainty and risk pricing. Real rates reveal the true policy stance after adjusting for inflation. And cross-pillar signals like the Credit-Labor Gap tell you whether credit markets are correctly pricing the macro reality underneath.
When most of these point the same direction, the signal is clean. When they diverge, the signal is unstable, and instability resolves.
The Indicators That Matter
A. High-Yield Credit Spreads: The Risk Pricing Signal
The option-adjusted spread on high-yield corporate bonds is the single most important financial conditions indicator. It measures the additional yield investors demand above Treasuries for holding the riskiest investment-grade-adjacent debt. When spreads are tight, investors are complacent. When they blow out, fear is in the driver’s seat. The level alone does not tell you much. Where it sits in the distribution tells you everything.

At 319 basis points, HY spreads have widened roughly 30 basis points from their February lows. That is the first sustained move wider in over a year. But context matters: 319 bps is still the 14th percentile of the 20-year distribution. Spreads have been wider 86% of the time. The widening is directionally correct but barely a start. If the repricing we expect materializes, spreads need to reach 400 to 450 basis points to match the underlying macro reality.
Composition makes the tightness worse than it looks. Nearly 46% of the investment-grade universe is now rated BBB, up from 27% in the late 1990s. The index itself is lower quality at tighter spreads. When the repricing comes, the fallen angel risk (BBB downgrades to HY) accelerates the widening because forced sellers hit a market with no cushion.
Spread moves are nonlinear: they compress slowly and widen quickly. The move from 286 to 319 took three weeks. The move from 319 to 450, if it comes, could take days.
B. The Spread Mispricing Gap: What Spreads Price vs. What Defaults Deliver
A single spread number is just a price. The prescriptive question is whether that price is correct. To answer it, we plot HY spreads against the high-yield default rate shifted forward 12 months. This shows the gap between what the market expects and what actually materializes.

The mispricing gap is the distance between what spreads imply about future defaults and what the actual default trajectory suggests. At 319 basis points, spreads are priced for defaults near 2%. Rising delinquencies and weakening business conditions point toward 3.5 to 4%. That gap has historically closed in one direction: spreads widen to meet reality. In 2007, spreads sat at 260 basis points while the forward default rate was already climbing. Twelve months later, spreads were above 1,500.
C. Yield Curve: The Dis-Inversion Clock
The yield curve is the oldest recession predictor in the toolkit. An inverted curve (short rates above long rates) has preceded every recession since 1970. But here is the nuance consensus misses: the recession does not start during the inversion. It starts after the curve dis-inverts. The inversion is the warning. The dis-inversion starts the clock. The chart below makes this explicit.

The curve inverted in July 2022 and stayed inverted for 26 months, one of the longest inversions on record. It dis-inverted in September 2024. At +58 basis points today, the curve has steepened meaningfully as the Fed cuts, with the 2-year yield at 3.56% dropping faster than the 10-year at 4.12%. We are now 18 months past dis-inversion. The historical lag ranges from 6 to 16 months. We are past the window in which every prior cycle turned. That does not mean the signal has failed. It means either the lag is longer this time, or the recession takes a different form than the NBER’s traditional dating would capture.
D. NFCI Decomposition: The Headline Hides the War
The National Financial Conditions Index from the Chicago Fed synthesizes 105 indicators across risk, credit, and leverage into a single weekly reading. Negative values indicate conditions looser than average. Positive values indicate tighter than average. But the headline number is a blended average. The subcomponents tell a different story.

NFCI at -0.52 says financial conditions are loose. But decomposing it reveals who is doing the talking. The Risk subindex at -0.61 is doing almost all the work, reflecting spreads that are still historically tight and an equity market that, despite the recent selloff, remains near record levels. The Credit subindex at -0.02 is essentially flat, barely loose. The Leverage subindex at -0.04 is the same. The headline is a one-legged stool. If the Risk subindex catches up to what Credit and Leverage are saying, the NFCI moves toward zero fast.
E. Bank Lending Standards: The Physical Transmission
The Senior Loan Officer Opinion Survey (SLOOS) is the most forward-looking indicator in the financial pillar. It measures what banks are actually doing with credit availability. When banks tighten standards, loan growth contracts 2 to 4 quarters later. When loan growth contracts, capex and hiring follow.

Here is where the story has shifted. Through 2025, SLOOS was the bearish signal we leaned on hardest: banks tightening while markets celebrated. That tightening has now reversed. SLOOS at 0.0% means banks are neither tightening nor easing on net. Loan growth has improved from +1.2% a year ago to +2.9%. The credit channel is healing.
This is the bull case data point. If bank standards continue easing and loan growth accelerates above +5%, the bearish financial thesis weakens considerably. We are watching this closely. But one quarter of neutral SLOOS after two years of tightening is not an all-clear. The damage from the tightening cycle (delinquencies, constrained borrowers, deferred capex) is still working through the system. Loan growth at +2.9% is below nominal GDP growth. Credit is flowing, but not freely.
F. The Transmission Gap: Real Rates vs. Credit Spreads
The nominal Fed Funds rate tells you what the Fed charges. The real rate tells you what borrowers actually feel. But the prescriptive question is whether markets are transmitting that policy stance. To answer it, we plot real rates against HY spreads on the same chart. When real rates are falling and spreads are widening, the transmission mechanism is inverting. Policy is easing but risk is repricing anyway.

This is the new divergence. Real Fed Funds at +0.50% is the least restrictive since the hiking cycle began. The Fed has delivered 85 basis points of cuts since September 2025. But HY spreads are widening, not tightening. The VIX has doubled. Equities are selling off. The market is tightening financial conditions faster than the Fed is loosening them. This pattern, where rate cuts fail to arrest a risk repricing, is what characterized the early stages of 2001 and 2007. It does not mean we are headed for those outcomes. It means the Fed’s grip on the transmission mechanism is weaker than the dot plot implies.
G. The Vol Signal: VIX vs. VVIX
The VIX tells you what the equity market thinks about near-term risk. The VVIX (volatility of VIX) tells you what the options market thinks about tail risk. When VVIX rises faster than VIX, dealers are hedging outcomes that the equity market has not yet priced. It is the vol market’s early warning system.

VIX at 25.5 after touching 29.5 on March 6 is the highest sustained reading since October 2023. But the VVIX tells a more nuanced story. Through most of 2025, VVIX was elevated relative to VIX, a signal that options dealers were hedging tail scenarios even while headline vol was suppressed. That divergence resolved violently in Q1 2026 as VIX caught up. The question now: does VIX settle back into the teens (the 2024-2025 pattern) or has the vol regime shifted? The VVIX/VIX relationship suggests the latter. When vol-of-vol stays elevated after VIX spikes, the market is not pricing a one-off event. It is pricing a new regime.
H. Banks See It, Spreads Don’t: Delinquencies vs. HY OAS
Credit spreads price expected defaults. Delinquencies show you actual defaults forming. The prescriptive chart plots the two together: credit card delinquency rates against HY OAS. Both rise during stress. When delinquencies rise and spreads stay flat, someone is wrong.

Credit card delinquencies at 2.94% remain elevated by post-pandemic standards. The Q3 2025 reading is the latest available (delinquency data lags by roughly two quarters). Banks saw this deterioration throughout 2025, which is why they tightened standards aggressively. Now that SLOOS has eased to neutral, the question is whether delinquencies are peaking or still climbing. The Q4 2025 data, when it arrives, will be critical. If delinquencies continue rising even as banks ease standards, the credit cycle is deteriorating on its own momentum.
I. Equity Risk Premium: The Margin of Safety
The equity risk premium measures whether stocks are cheap or expensive relative to bonds. It is the earnings yield (inverse of P/E) minus the real 10-year yield. A high ERP means stocks are cheap relative to bonds. A low ERP means bonds are competitive. The level matters, but context matters more. We plot ERP with regime bands and annotated historical outcomes.

The equity risk premium has improved from roughly 2.5% in January to approximately 3.0% today, driven by both falling real yields (10Y TIPS from 2.25% to 1.78%) and the equity selloff (SPX from ~5,900 to ~5,740). That is the right direction. But 3.0% is still below the historical average of roughly 4%, still in the “Expensive” regime. The margin of safety is thin. Another 10% equity drawdown with stable real yields would push ERP toward 3.5%, which starts to look more reasonable. We are not there yet.
J. Credit Quality Differentiation: The HY/IG Ratio
The ratio of HY spreads to IG spreads tells you whether the market is discriminating between credit quality tiers. When the ratio is stable, all credit is being treated the same. When it rises, the market is repricing risk in the lowest quality tranches while investment grade holds steady. Rising quality differentiation has preceded every major credit event.

At 3.7x, the HY/IG ratio has risen from 3.1x in January. That is the sharpest move in the ratio since early 2020. It tells you that HY spreads are widening faster than IG spreads, which means the market is not just repricing duration or rates. It is repricing credit risk specifically. IG at 85 bps is holding tight while HY has widened 30 bps. The gap between the two is growing. Historically, the ratio spikes above 5x during crises. We are not there, but the direction is unambiguous. When the market starts discriminating, it does not stop halfway.
K. The Financial Cascade: You Are Here
Financial stress follows a sequence. It is not random. The order is remarkably consistent across cycles: the yield curve inverts, then dis-inverts, then banks tighten, then loan growth stalls, then spreads widen, then volatility spikes, then defaults rise, then recession begins. The chart below maps where we sit in this progression.

Six of eight steps are now complete. The curve inverted (July 2022). It dis-inverted (September 2024). Banks tightened (SLOOS peaked at 50.8% in Q3 2023, now eased to neutral). Loan growth decelerated to +1.2% before recovering to +2.9%. The VIX spiked to 29.5 on March 6. Spreads have begun widening (286 to 319 bps in three weeks) but have not yet reached the 400 bps threshold.
The marker sits between steps 5 and 6. The open question is whether the SLOOS easing and rate cuts can arrest the sequence before spreads widen past 400 bps and defaults rise. That is the live tension. The Fed is fighting the cascade with rate cuts. Whether 85 basis points is enough depends on whether the market repricing accelerates or stabilizes.
L. Financial Stress Convergence: Three Public Signals
No single indicator captures financial stress. But when multiple independent signals converge, the message becomes harder to dismiss. We normalize three widely tracked stress measures (Baa corporate spread over 10-year Treasuries, the Chicago Fed NFCI, and the VIX) into comparable z-scores and overlay them. When all three rise together, stress is broad-based. When they diverge, stress is isolated to one channel.

The three signals are beginning to converge. The Baa-10Y spread z-score has ticked up as corporate spreads widen. The VIX z-score has spiked. The NFCI z-score remains negative (conditions still registering loose on average) but is moving toward zero. Full convergence above +1.5 sigma is the stress zone, where all three agree that conditions are deteriorating across credit, equity, and composite measures simultaneously. We are not there. But the directional alignment is notable: all three are moving in the same direction for the first time since early 2020. Isolated stress is manageable. Converging stress is not.
M. The BBB Cliff: Fallen Angel Risk
Credit quality has deteriorated even as spreads compressed. In the late 1990s, BBB-rated bonds (the lowest investment-grade tier) made up 27% of the IG universe. Today that number is 47%. Nearly half of all “investment grade” bonds are one downgrade from junk.

This is not a cyclical risk. It is structural. IG-mandated funds cannot hold junk-rated bonds. When a BBB issuer gets downgraded, it becomes a “fallen angel,” forced out of IG indices and dumped by passive vehicles and mandated accounts simultaneously. The selling is mechanical, not discretionary. In a stress scenario where multiple issuers get downgraded at once, the HY market must absorb a flood of supply at exactly the moment it is least able to. The BBB cliff makes every spread widening episode more dangerous than it would have been 20 years ago, because the index itself is lower quality at tighter spreads.
N. The Tug-of-War: What Pulls Loose, What Pulls Tight
Financial conditions are not a single number. They are a collection of forces pulling in different directions. The chart below decomposes the current state into individual components, each measured as a z-score against its own 5-year history. Bars pulling left (negative, Ocean) are pushing conditions looser. Bars pulling right (positive, Dusk) are pushing conditions tighter.

The tug-of-war explains why the NFCI headline is misleading. The Risk subindex (which captures equity vol, credit default swaps, and funding spreads in aggregate) is deeply negative, dragging the composite into “loose” territory. But the VIX is over one standard deviation tight. Real rates are restrictive. SLOOS has eased but is still negative relative to history. The forces pulling tight are real-economy forces (rates, lending standards). The forces pulling loose are market-pricing forces (spreads, risk premiums). When the two sides are this divided, the resolution tends to be sudden, not gradual.
The Consensus Trap
“The Fed is cutting. Financial conditions are easing.”
The NFCI is negative. The Fed has delivered 85 basis points of cuts. SLOOS has flipped to neutral. Case closed. This is the consensus view, and it has the data to support it if you only look at the policy channel. But the market channel is tightening: VIX has doubled, spreads are widening, and equities are selling off. Rate cuts do not automatically loosen financial conditions. They loosen one input. The other inputs have minds of their own. In 2001, the Fed cut 475 basis points and financial conditions tightened the entire way down. In 2007-2008, the Fed cut 500 basis points while spreads blew out to 2,000. The policy rate is necessary but not sufficient.
“VIX spiked, so the fear trade is overdone.”
VIX at 25.5 is elevated relative to January’s 14. It is not elevated relative to the macro backdrop. A VIX in the low 20s with labor fragility elevated, growth decelerating, and geopolitical uncertainty elevated is not fear. It is fair value. The question is not whether 25 is “too high.” It is whether 14 was too low. We think the answer is obviously yes.
The sharper question: are the Fed’s rate cuts enough to arrest the cascade, or are they arriving too late to prevent the spread repricing from feeding into defaults and earnings? We do not know the answer yet. But the cascade advancing through steps 5 and 6 while the Fed cuts is not the soft landing script.
Where We Are Now
Net assessment: The financial cascade is advancing. Two months ago, we were between steps 4 and 5. Now step 5 (spread widening) is underway and step 6 (vol spike) is in progress. The Fed is fighting the cascade with rate cuts. Banks have eased to neutral. But the market is repricing anyway.
The bull case is real: SLOOS at neutral, loan growth improving, real rates falling, 85 bps of cuts delivered. If this continues, the cascade arrests. The bear case is also real: spreads widening, vol spiking, equities selling off, the HY/IG ratio rising sharply, and rate cuts historically insufficient to prevent repricing once the cascade is in motion.
We are at the pivot point. The next two to three months determine whether the easing is enough. Watch SLOOS (does it continue easing or reverse?), HY OAS (does it stabilize at 320 or push toward 400+?), and the VIX (does it settle in the low 20s or sustain above 25?). The answers will tell you whether the cascade arrests at step 5 or completes.
How to Track This
Daily: HY OAS (ICE BofA via FRED), VIX, Treasury yields, SOFR. These are real-time market signals.
Weekly: Chicago Fed NFCI (released Wednesday), Fed H.8 bank lending data. The weekly cadence captures credit transmission in near-real-time.
Monthly: Consumer credit (Fed G.19, ~5 week lag), delinquency data (quarterly, ~2 quarter lag).
Quarterly (~30 day lag): Senior Loan Officer Opinion Survey. Most lagging but most predictive. The Q2 2026 SLOOS will be critical for confirming whether the easing trend holds.
Continuous: Our FCI composite and CLG are updated with each data refresh. The cascade progression is the primary signal to monitor.
Invalidation Criteria
Bull Case (Cascade Arrests, Soft Landing Confirmed) Confirmation:
HY OAS reverses below 300 bps and holds for 4+ weeks
SLOOS continues easing toward net loosening (<-10%)
C&I loan growth accelerates above +5%
VIX settles below 20
CLG improves above -0.5 (credit catches up to labor)
Equities recover to new highs
Current status: 1 of 6 conditions met (SLOOS easing trend intact).
Action if confirmed: The Fed’s cuts worked. Financial conditions are genuinely loosening. Overweight high-beta credit, financials, and cyclicals. The cascade stopped at step 5.
Bear Case (Cascade Completes, Financial Stress Materializes) Confirmation:
HY OAS exceeds 450 bps (risk repricing accelerates)
VIX sustains above 30 (fear regime)
NFCI crosses above 0 (conditions tighter than average)
SLOOS reverses back above +10% (banks re-tighten)
Defaults rise above 4%
FCI drops below -0.5 (tight regime)
Current status: 0 of 6 conditions met, but VIX briefly touched 29.5.
Action if confirmed: Maximum defensive. Overweight cash, long Treasuries, gold. Avoid all credit risk. The cascade completed despite rate cuts.
The Bottom Line
The Fed sets a rate. Financial conditions determine whether it matters. Right now, the Fed is cutting and financial conditions are tightening anyway. That is the story of March 2026.
The financial cascade has advanced. Six steps are complete. Steps 7 and 8 remain. The Fed is fighting it with rate cuts. Banks have eased to neutral. But vol has spiked, spreads are widening, and equities are selling off. The market is doing what markets do when the macro backdrop deteriorates: repricing risk faster than policy can offset it.
The NFCI says conditions are loose. Decompose it and you find a one-legged stool: the Risk subindex carries the entire reading while Credit and Leverage sit at neutral. The Credit-Labor Gap remains deeply negative: spreads have widened but not nearly enough to reflect labor fragility. The equity risk premium has improved but is still below its historical average. The dis-inversion clock is 18 months in and counting.
This pillar connects directly to what came before and what comes next. Government fiscal stress (Pillar 8) widens the term premium, which tightens financial conditions from the long end even as the Fed cuts the short end. Plumbing (Pillar 10) determines whether the system has the reserves to absorb the repricing when it accelerates. All three Monetary Mechanics pillars are pointing in the same direction: the system is under more stress than the headline numbers suggest.
Stability is a signal, not a comfort. The calmest readings in the financial system tend to cluster right before the repricing begins. That is not a warning to panic. It is a reminder that the absence of stress is not the same as the presence of safety.
Watch the cascade. Six steps are done. Two remain. The next domino is defaults. If they rise, the sequence completes regardless of how many basis points the Fed delivers.
This is the 9th in a 12-part series on the Lighthouse Macro framework.
Next up: Plumbing and the Liquidity Architecture
Bob Sheehan, CFA, CMT
Founder & CIO, Lighthouse Macro