

Government: The Fiscal Overhang
The Diagnostic Dozen: A Framework for Reading the Macro Cycle (8 of 12)

The Diagnostic Dozen Educational Series
Previously: Labor | Prices | Growth | Consumer | Housing | Business | Trade
Everyone talks about the Fed. Not enough people talk about the entity that actually moves the most money through the system: the U.S. Treasury. The Federal Reserve sets the price of overnight money. The Treasury decides how much debt to issue, at what maturity, and on what schedule. One controls the short end. The other floods the entire curve. And right now, the one doing the flooding is running deficits that used to be reserved for wars and depressions.
When fiscal deficits run at 6% of GDP outside of recession, that is not stimulus. That is structural. When interest on the debt exceeds $1 trillion annually, that is not a line item. That is a compounding trap. And when the entity backstopping the system is also the one straining it, you get a risk that does not show up in earnings calls or CPI prints. It shows up in the term premium. In auction tails. In the slow repricing of what “risk-free” actually means.
This is Pillar 8. The first pillar in our Monetary Mechanics engine. Where policy ambition collides with financing reality.
The Core Insight: The Borrower Has Become the Risk
Here is the chain. The government runs a structural deficit. That deficit must be financed with Treasury issuance. That issuance must be absorbed by someone. For the past fifteen years, the Federal Reserve was that someone, buying trillions through QE and suppressing term premium to near zero. That era is over. QT means the marginal buyer has shifted from the Fed (price-insensitive, buys at any yield) to the private market (price-sensitive, demands compensation for duration risk). When the buyer changes, the price changes. Term premium is the release valve.
We think the single most under-discussed risk in markets today is not a recession. It is the government’s tab. And unlike a recession, this one does not self-correct. Deficits do not narrow when growth slows because mandatory spending (Social Security, Medicare, interest) accelerates on autopilot. The math runs in one direction.
This is fiscal dominance: the government’s financing needs now dictate monetary conditions more than the Fed’s rate decisions. Term premium must reprice to roughly 150 basis points, the average that prevailed in the 1990s and 2000s when deficits were smaller and the Fed was not the marginal buyer. Currently around 50 basis points, it has a long way to go.
What to Watch and Why
The Government Conditions Index synthesizes seven weighted components into a single reading. But the individual indicators matter because they tell you different things at different speeds.
The deficit level tells you about structural dependence. The deficit trajectory (fiscal impulse) tells you about the growth impact of changes. Term premium tells you whether the market has noticed. Interest expense tells you about the compounding dynamic. Debt-to-GDP tells you about sustainability. The receipts-to-outlays gap tells you about the structural divergence. And foreign holdings tell you about the buyer base. Each indicator moves on a different timeline. Together they map the full picture of fiscal stress.
The Indicators That Matter
Federal Deficit as % of GDP: The Structural Baseline
The federal surplus or deficit as a percentage of GDP is the cleanest single measure of fiscal posture. Outside of recessions, the historical norm runs around 2-3% of GDP. During recessions, deficits typically widen to 5-10% as automatic stabilizers (unemployment insurance, lower tax receipts) kick in. The key distinction: cyclical deficits self-correct when the economy recovers. Structural deficits do not.
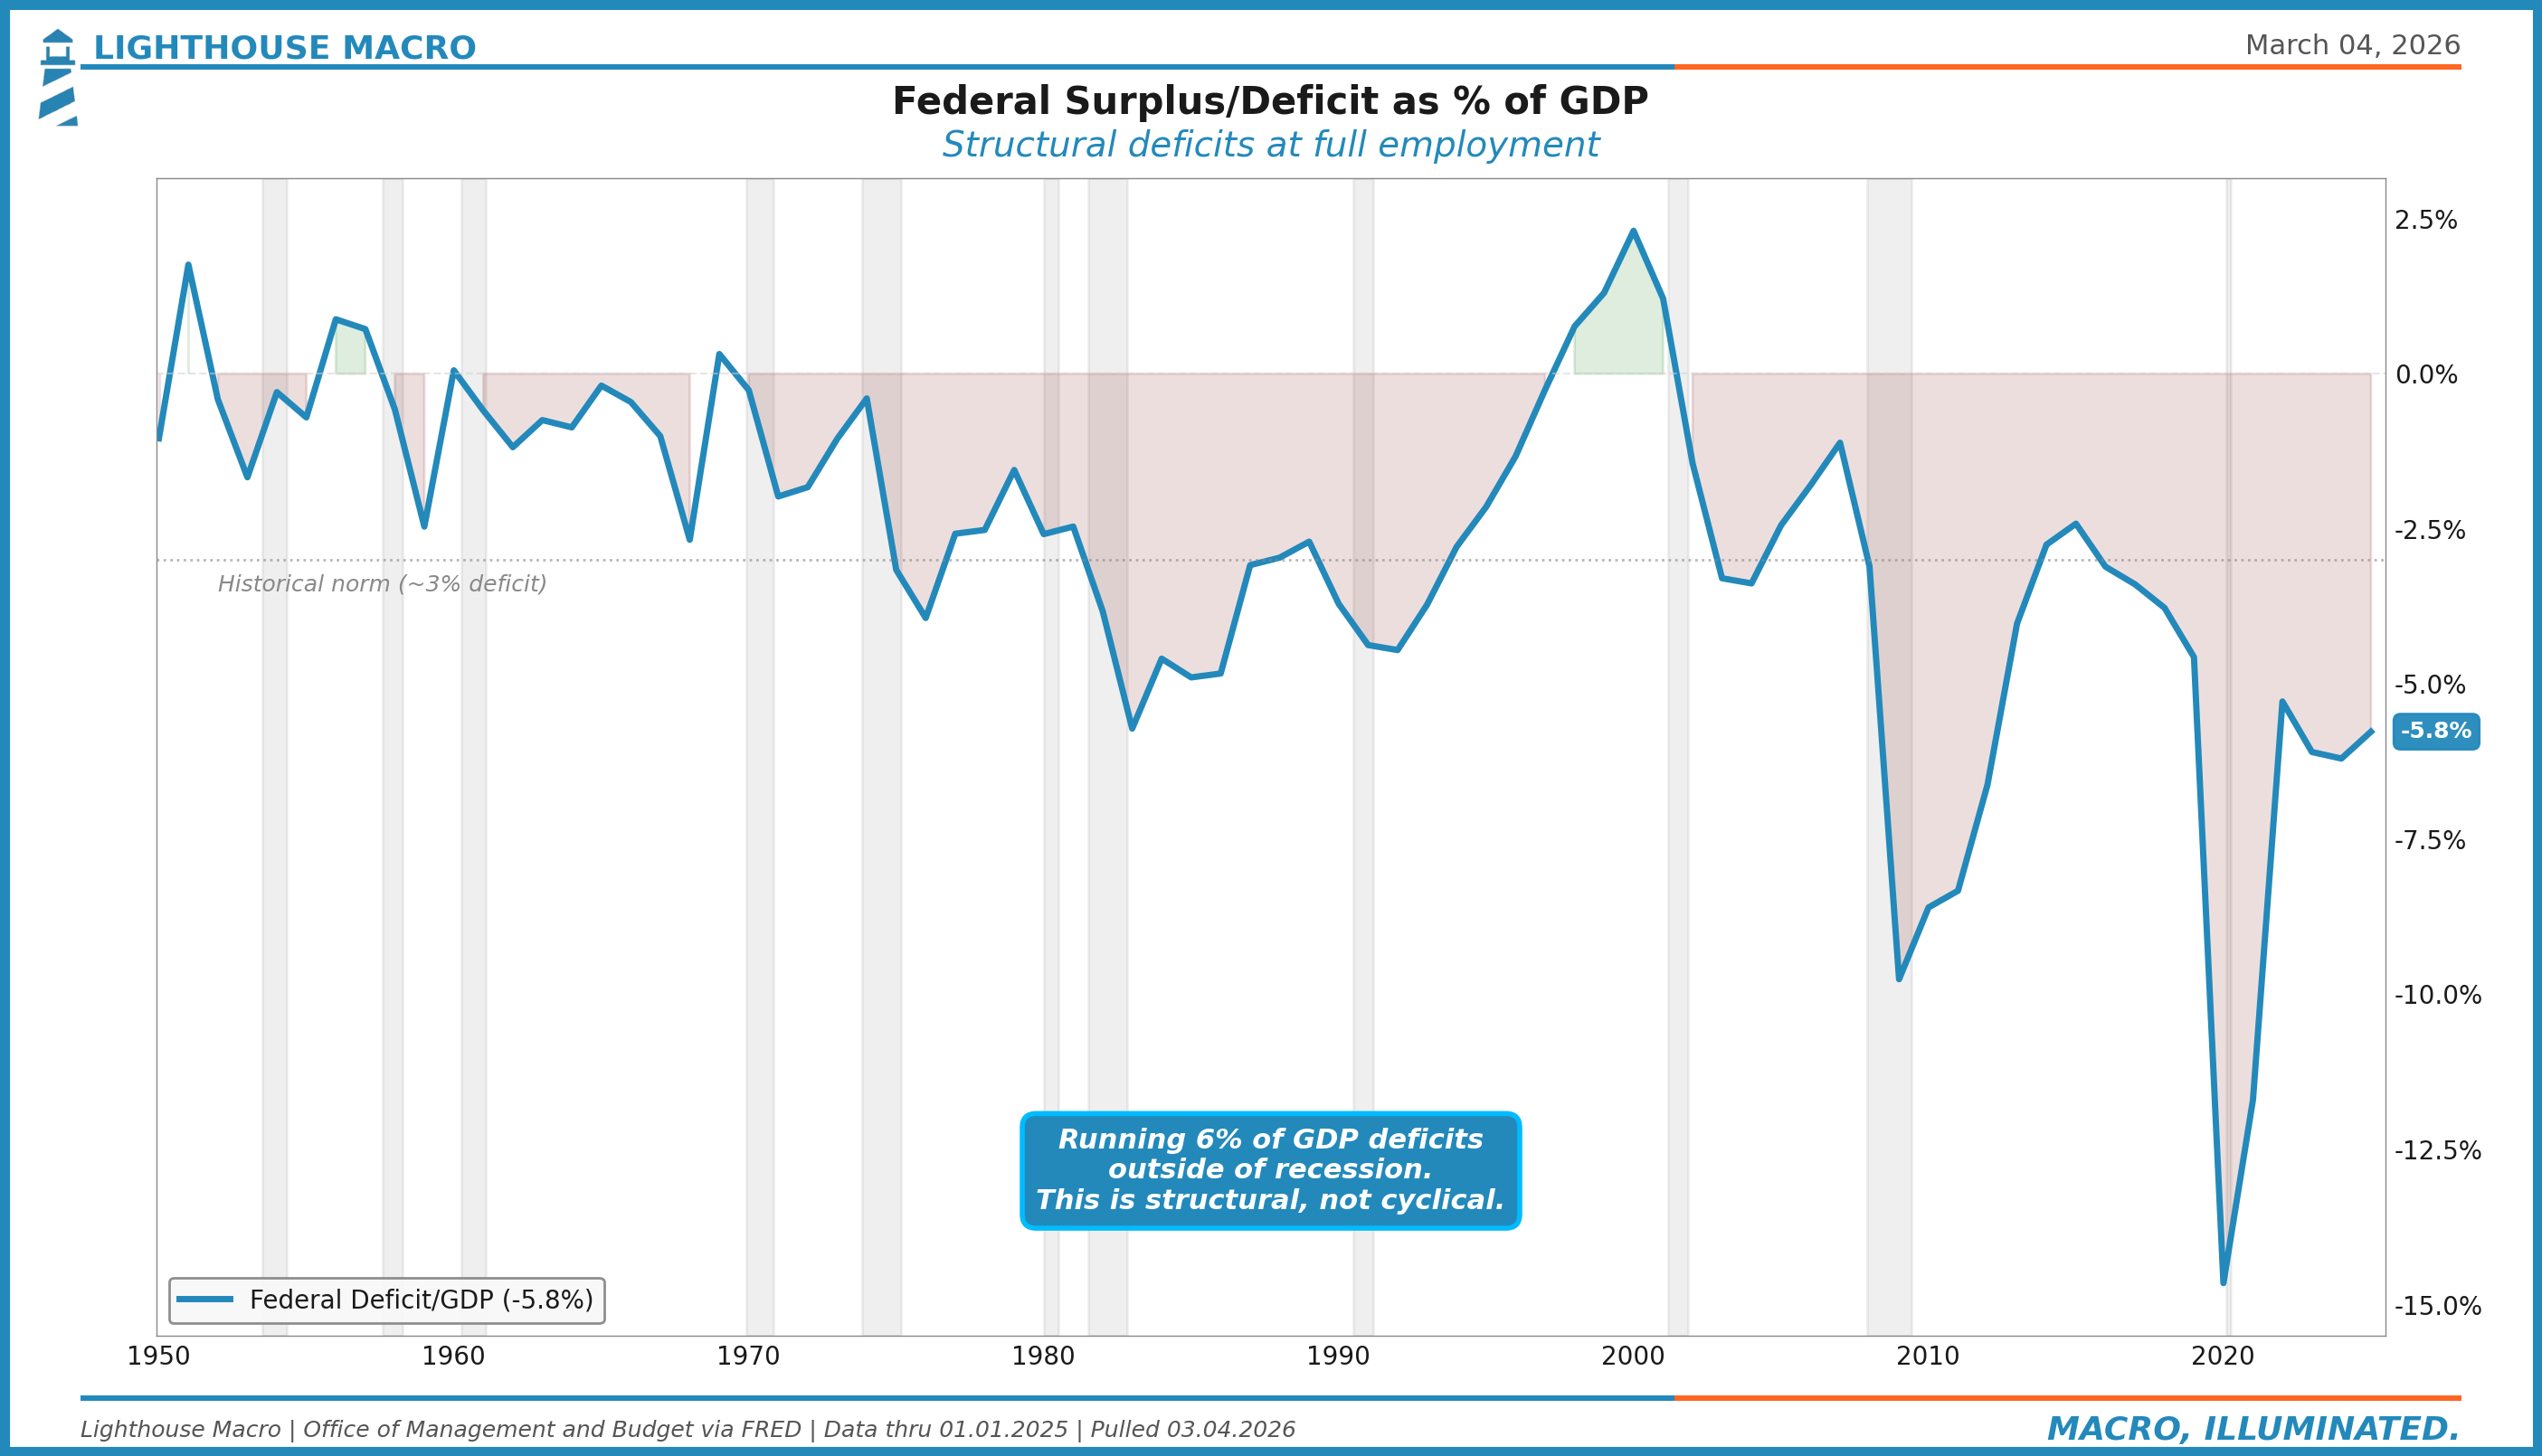
The current deficit at 5.8% of GDP is running at levels that used to require a recession to produce. The 2020 spike to -15% was an emergency. The persistence at -6% to -7% in 2023-2024 was not. This is the government spending more than it collects on a structural basis, driven by mandatory spending growth, elevated interest costs, and no political appetite for correction on either side.
For the framework, the level tells you about financing pressure. The direction tells you about growth impact. A deficit narrowing from 7% to 5% is technically contractionary (less government spending flowing into the economy) even though it is still a deficit. This is why spending cuts, if they materialize, are a macro drag regardless of their long-term fiscal virtue.
ACM 10-Year Term Premium: The Honest Signal
Term premium is the compensation investors demand for holding duration risk. It answers a simple question: how much extra yield do you need to lock up money for ten years instead of rolling short-term bills? After a decade of near-zero or negative term premium, thanks to the Fed’s QE purchases suppressing duration risk, it is normalizing.
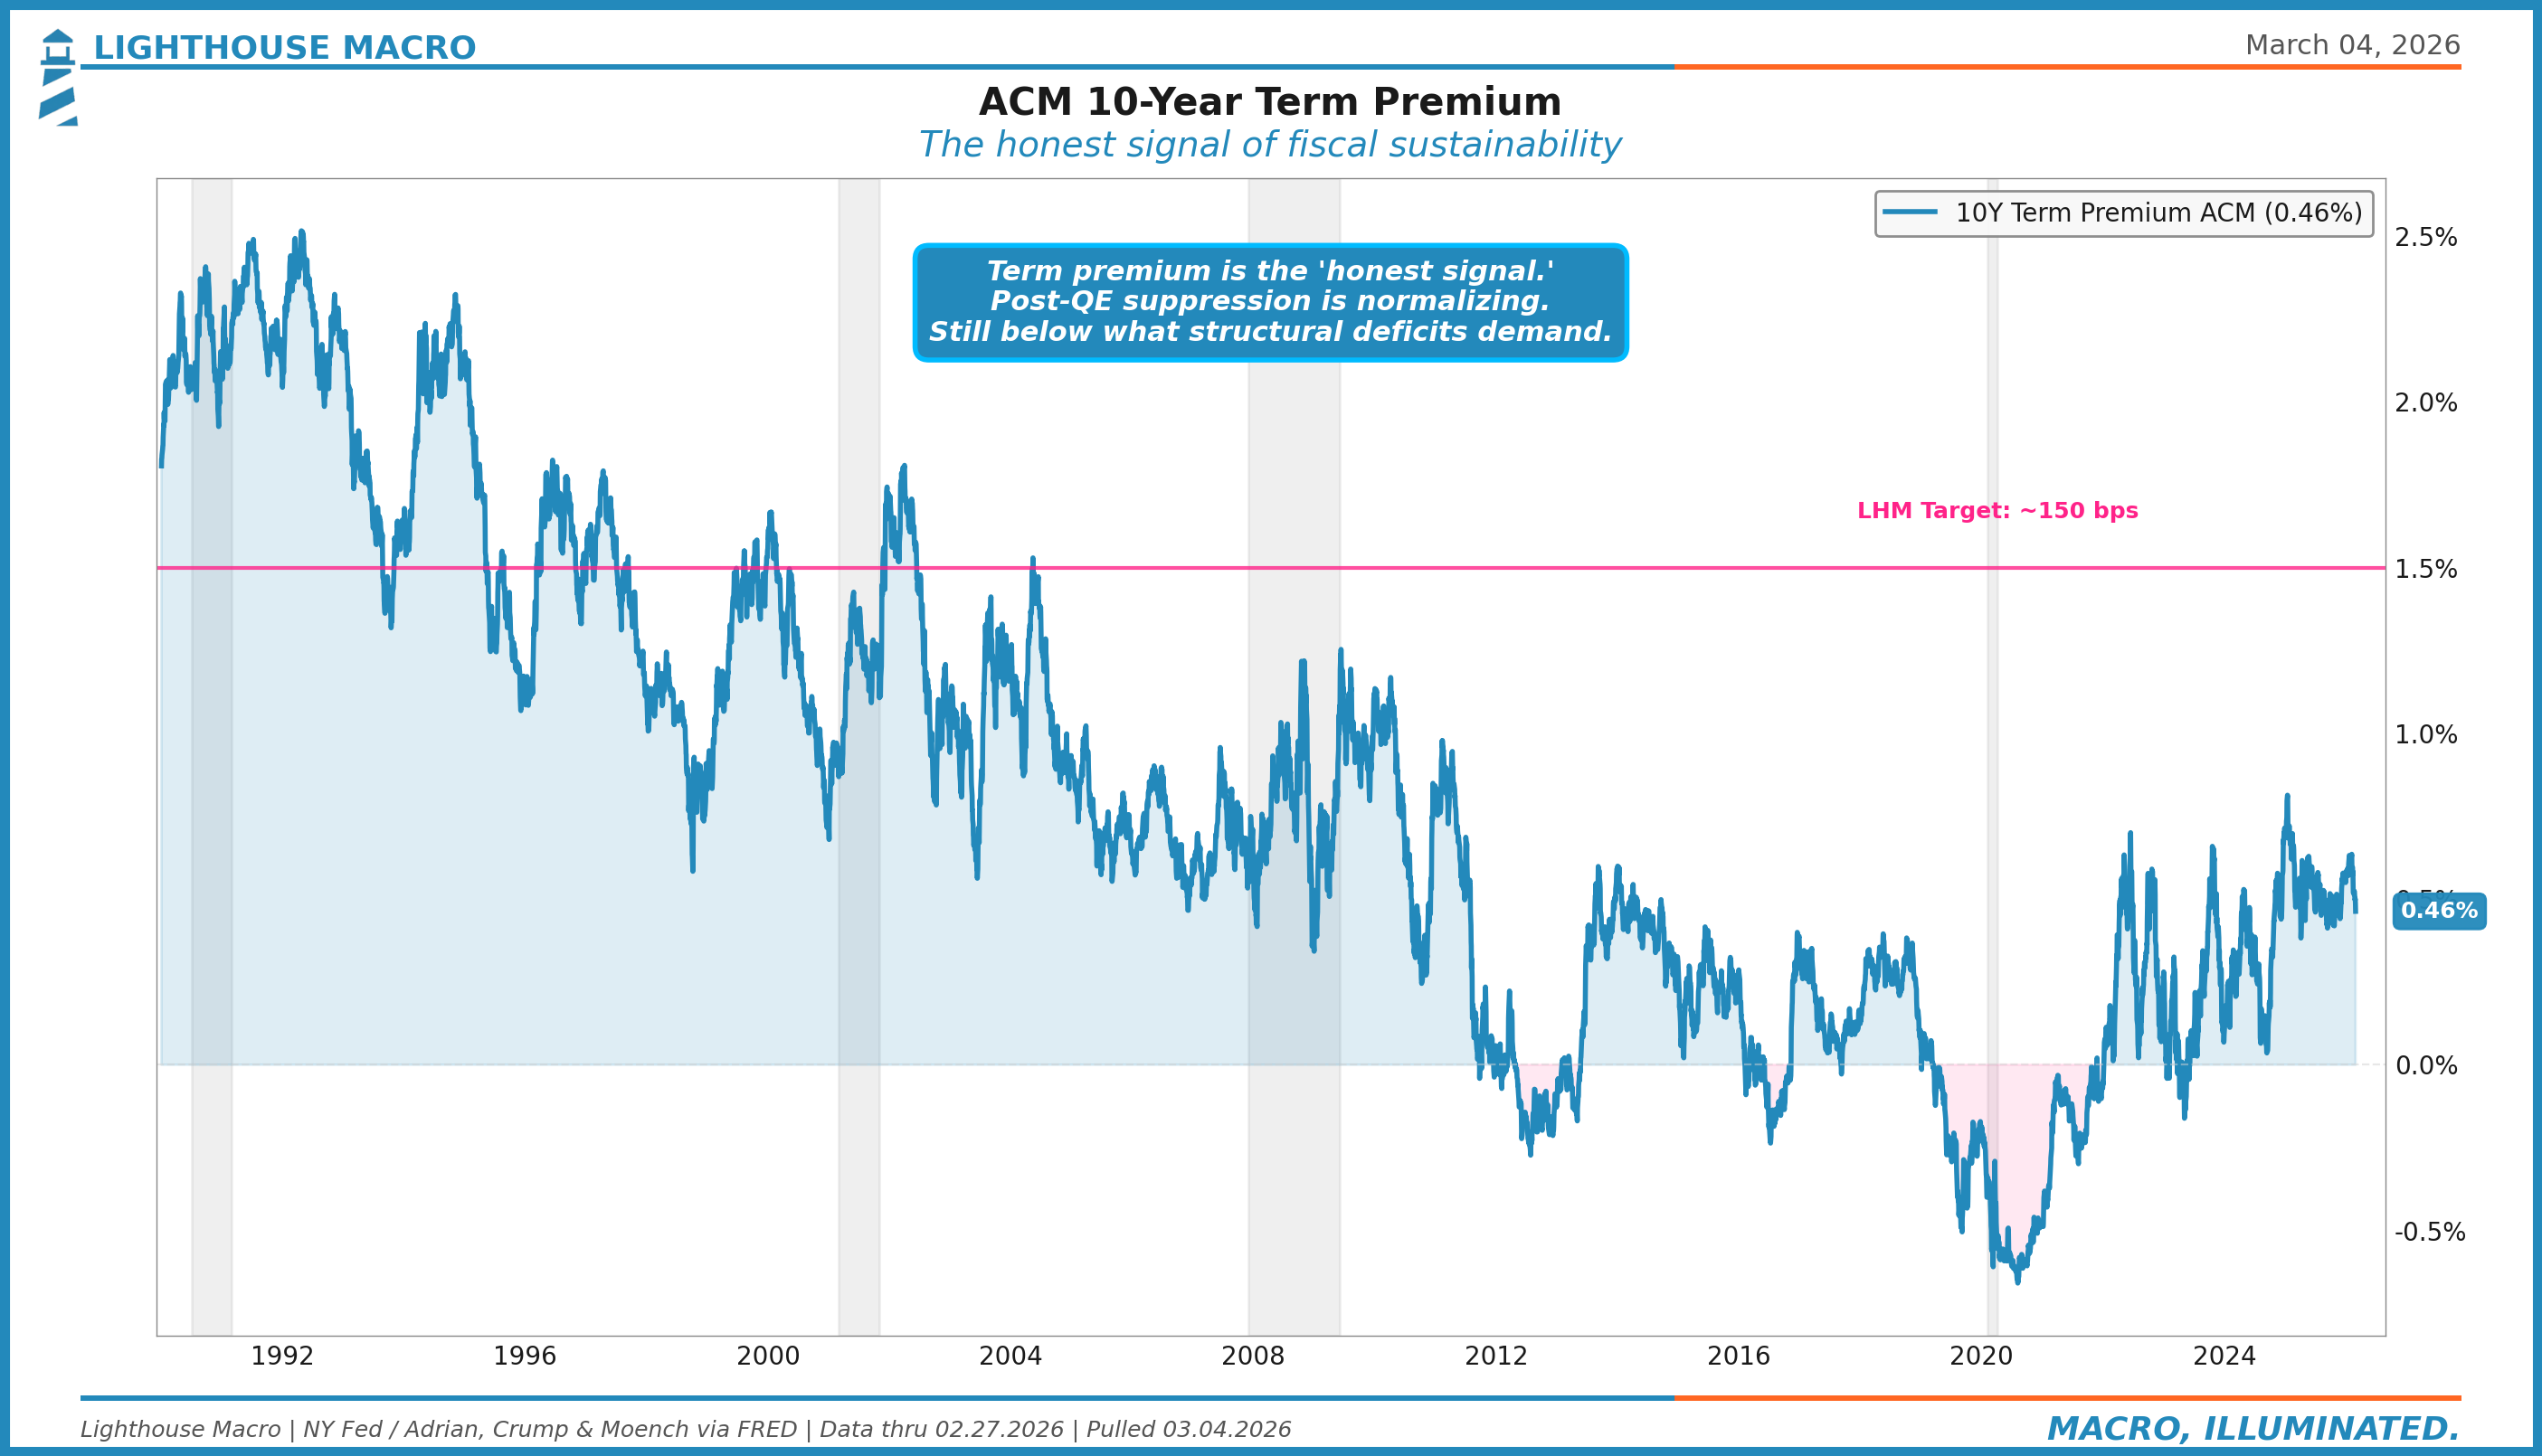
The ACM model from the New York Fed shows the 10-year term premium around 50 basis points. That is up meaningfully from the -50 to 0 basis point range that prevailed during the QE era, but still far below the 150-250 basis point range that characterized the 1990s and 2000s when deficits were smaller and the Fed was not buying.
We think term premium needs to reach roughly 150 basis points to properly compensate for structural deficits in a post-QT world. That is roughly the average that prevailed from 1990 to 2007, a period when deficits were half the current level and the Fed was not buying duration. With both conditions now worse, 150 is arguably conservative. Moody’s downgrade in May 2025, completing the trifecta of sub-AAA ratings from all three major agencies, removed one more anchor that had been suppressing the premium investors demand. That repricing, if and when it happens, would add approximately 100 basis points to 10-year yields without the Fed changing rates at all. This is the mechanism through which fiscal stress tightens financial conditions independently of monetary policy. The “honest signal” in our framework because it cannot be talked away by forward guidance or managed through dot plots.
10-Year Yield Decomposition: What Is Actually Driving Yields?
The 10-year yield tells you very little on its own. A 4.5% yield driven by expectations of higher short rates is very different from 4.5% driven by term premium. The former says the market expects the Fed to stay tight. The latter says the market demands compensation for fiscal risk. The investment implications are completely different.
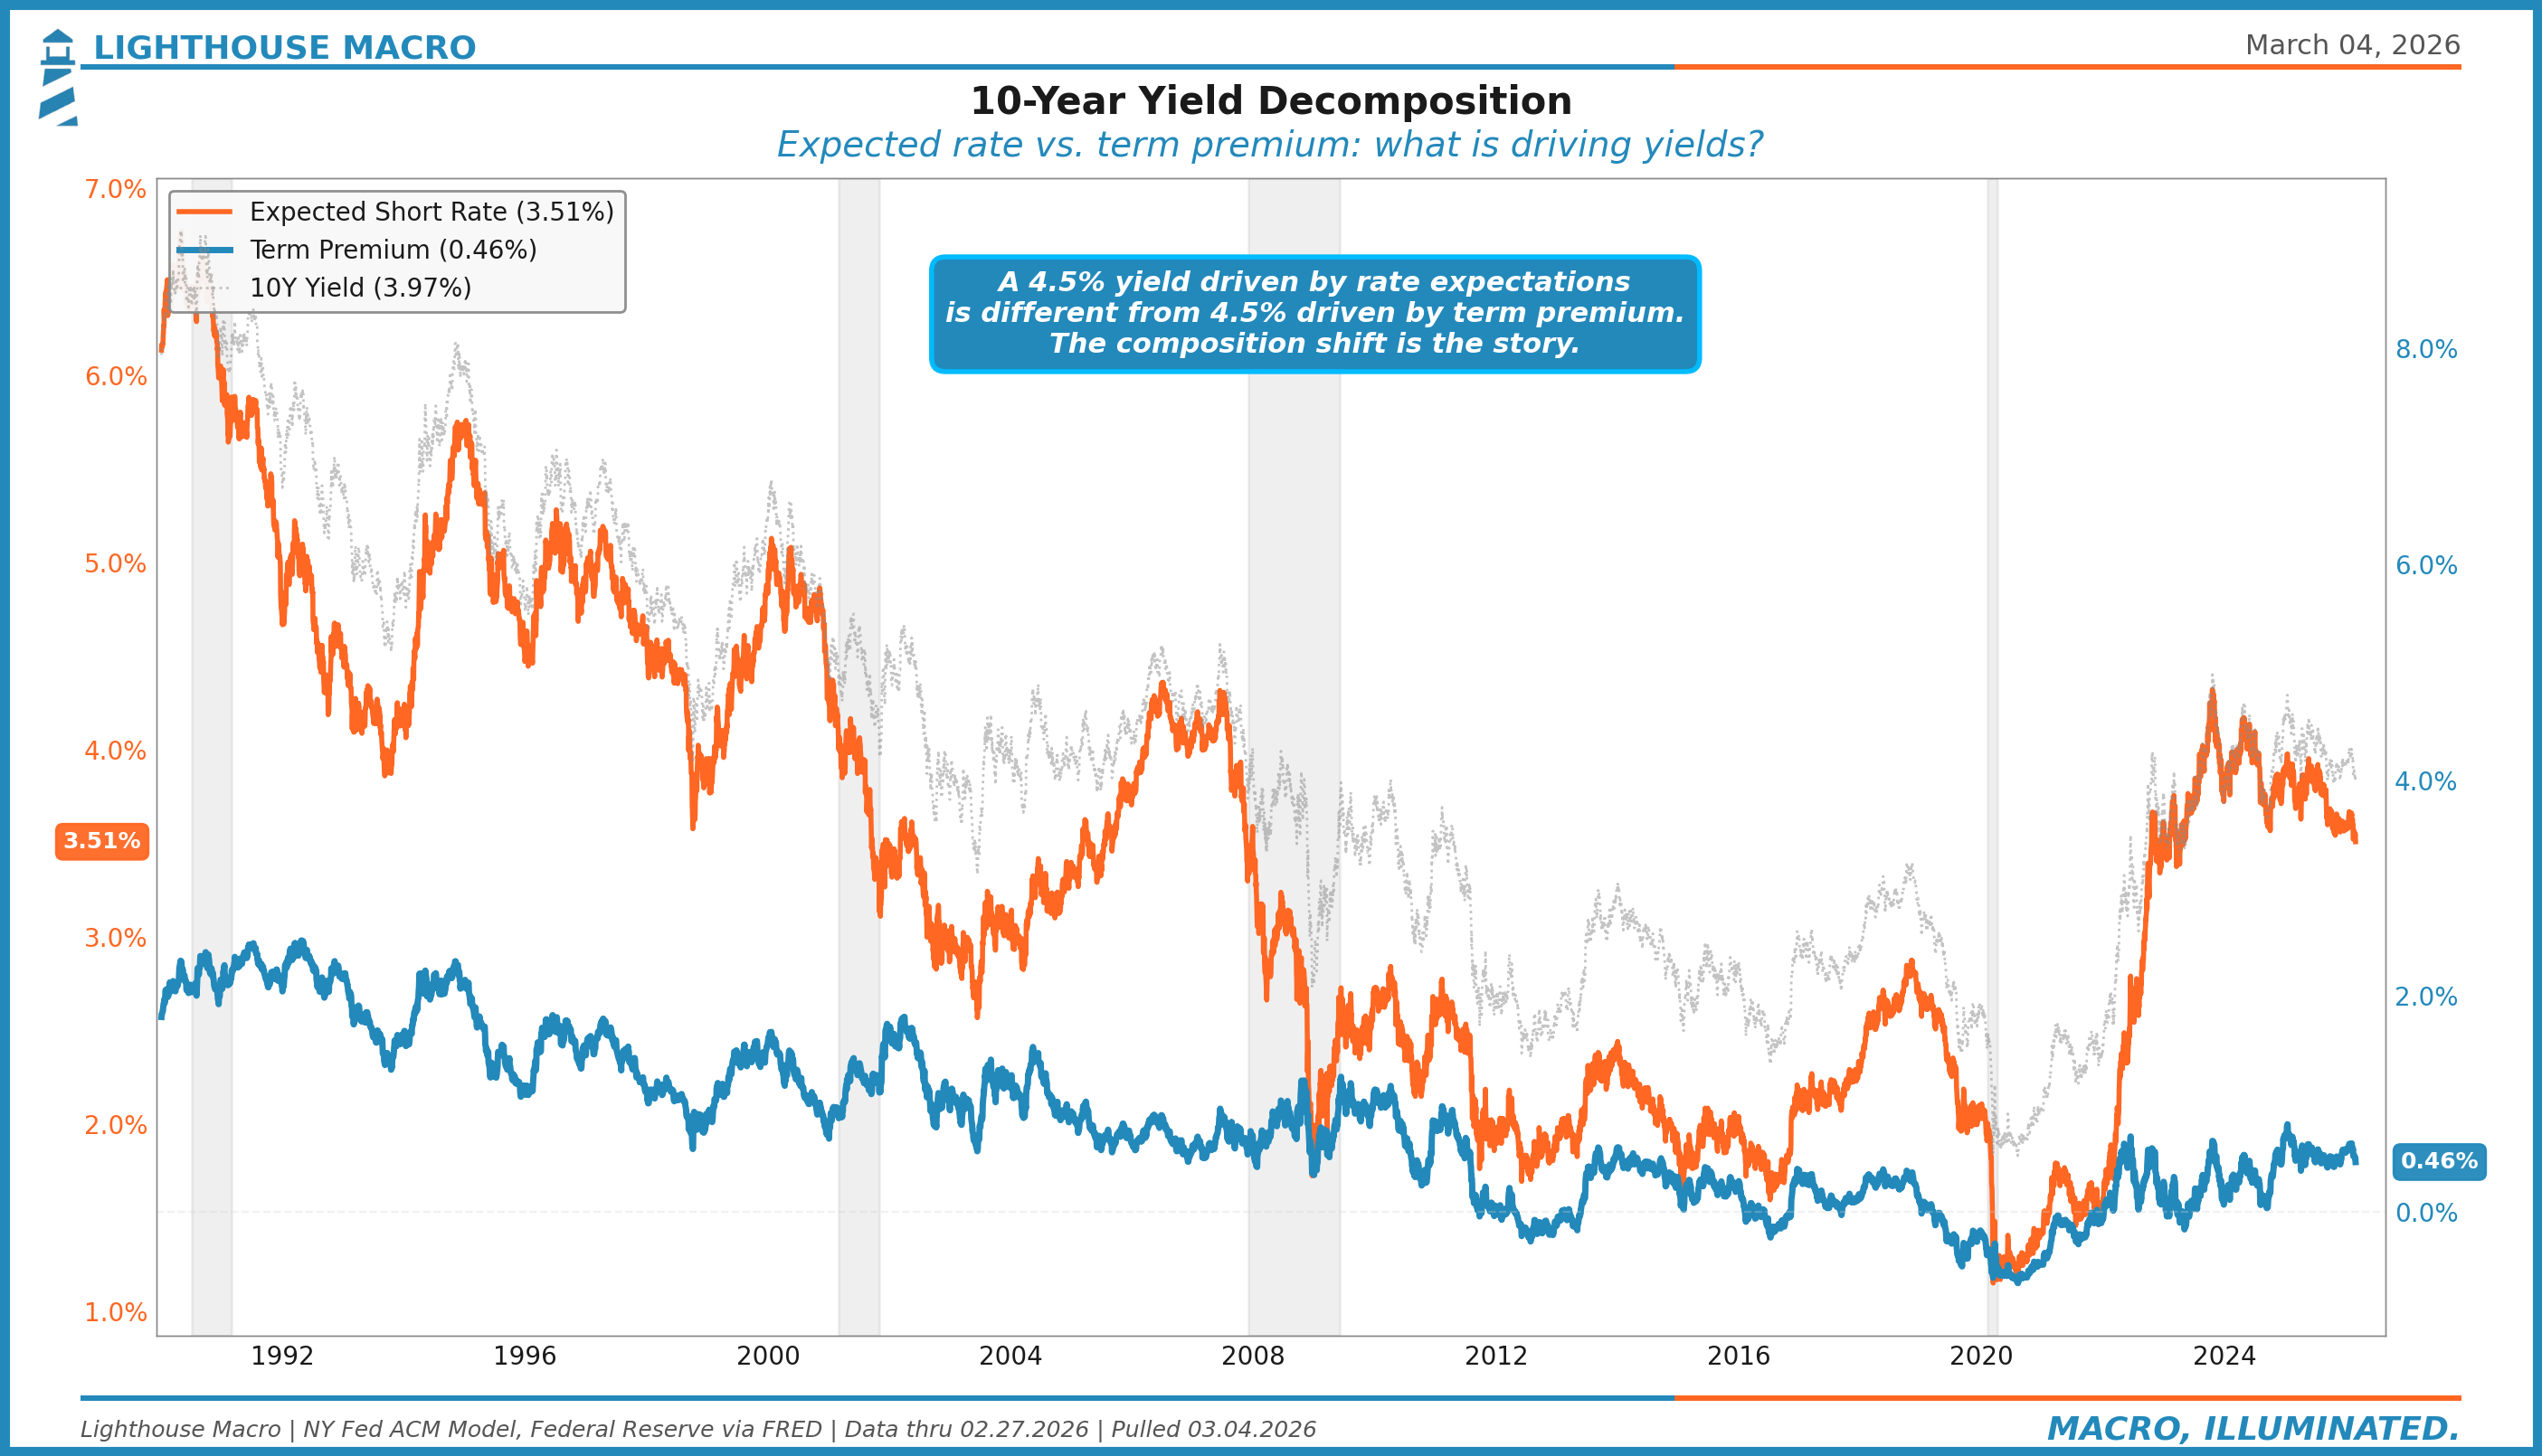
Currently, the expected short rate component (~3.55%) is doing most of the work, reflecting expectations that the Fed will keep policy rates elevated. But the term premium component (~0.50%) has been climbing. In the QE era, the term premium was doing negative work, actually pulling yields down. That dynamic has reversed. As QT continues and issuance remains heavy, term premium will increasingly drive the level of long rates. This is the composition shift we are watching: from a Fed-driven yield curve to a Treasury-driven yield curve.
Federal Interest Expense: The Compounding Trap
This is where the math gets uncomfortable. On an annualized basis, federal interest payments now consume roughly 21% of revenue. That means more than one in five dollars the government collects goes straight to servicing existing debt. Not building roads. Not funding defense. Not paying Social Security. Just interest.
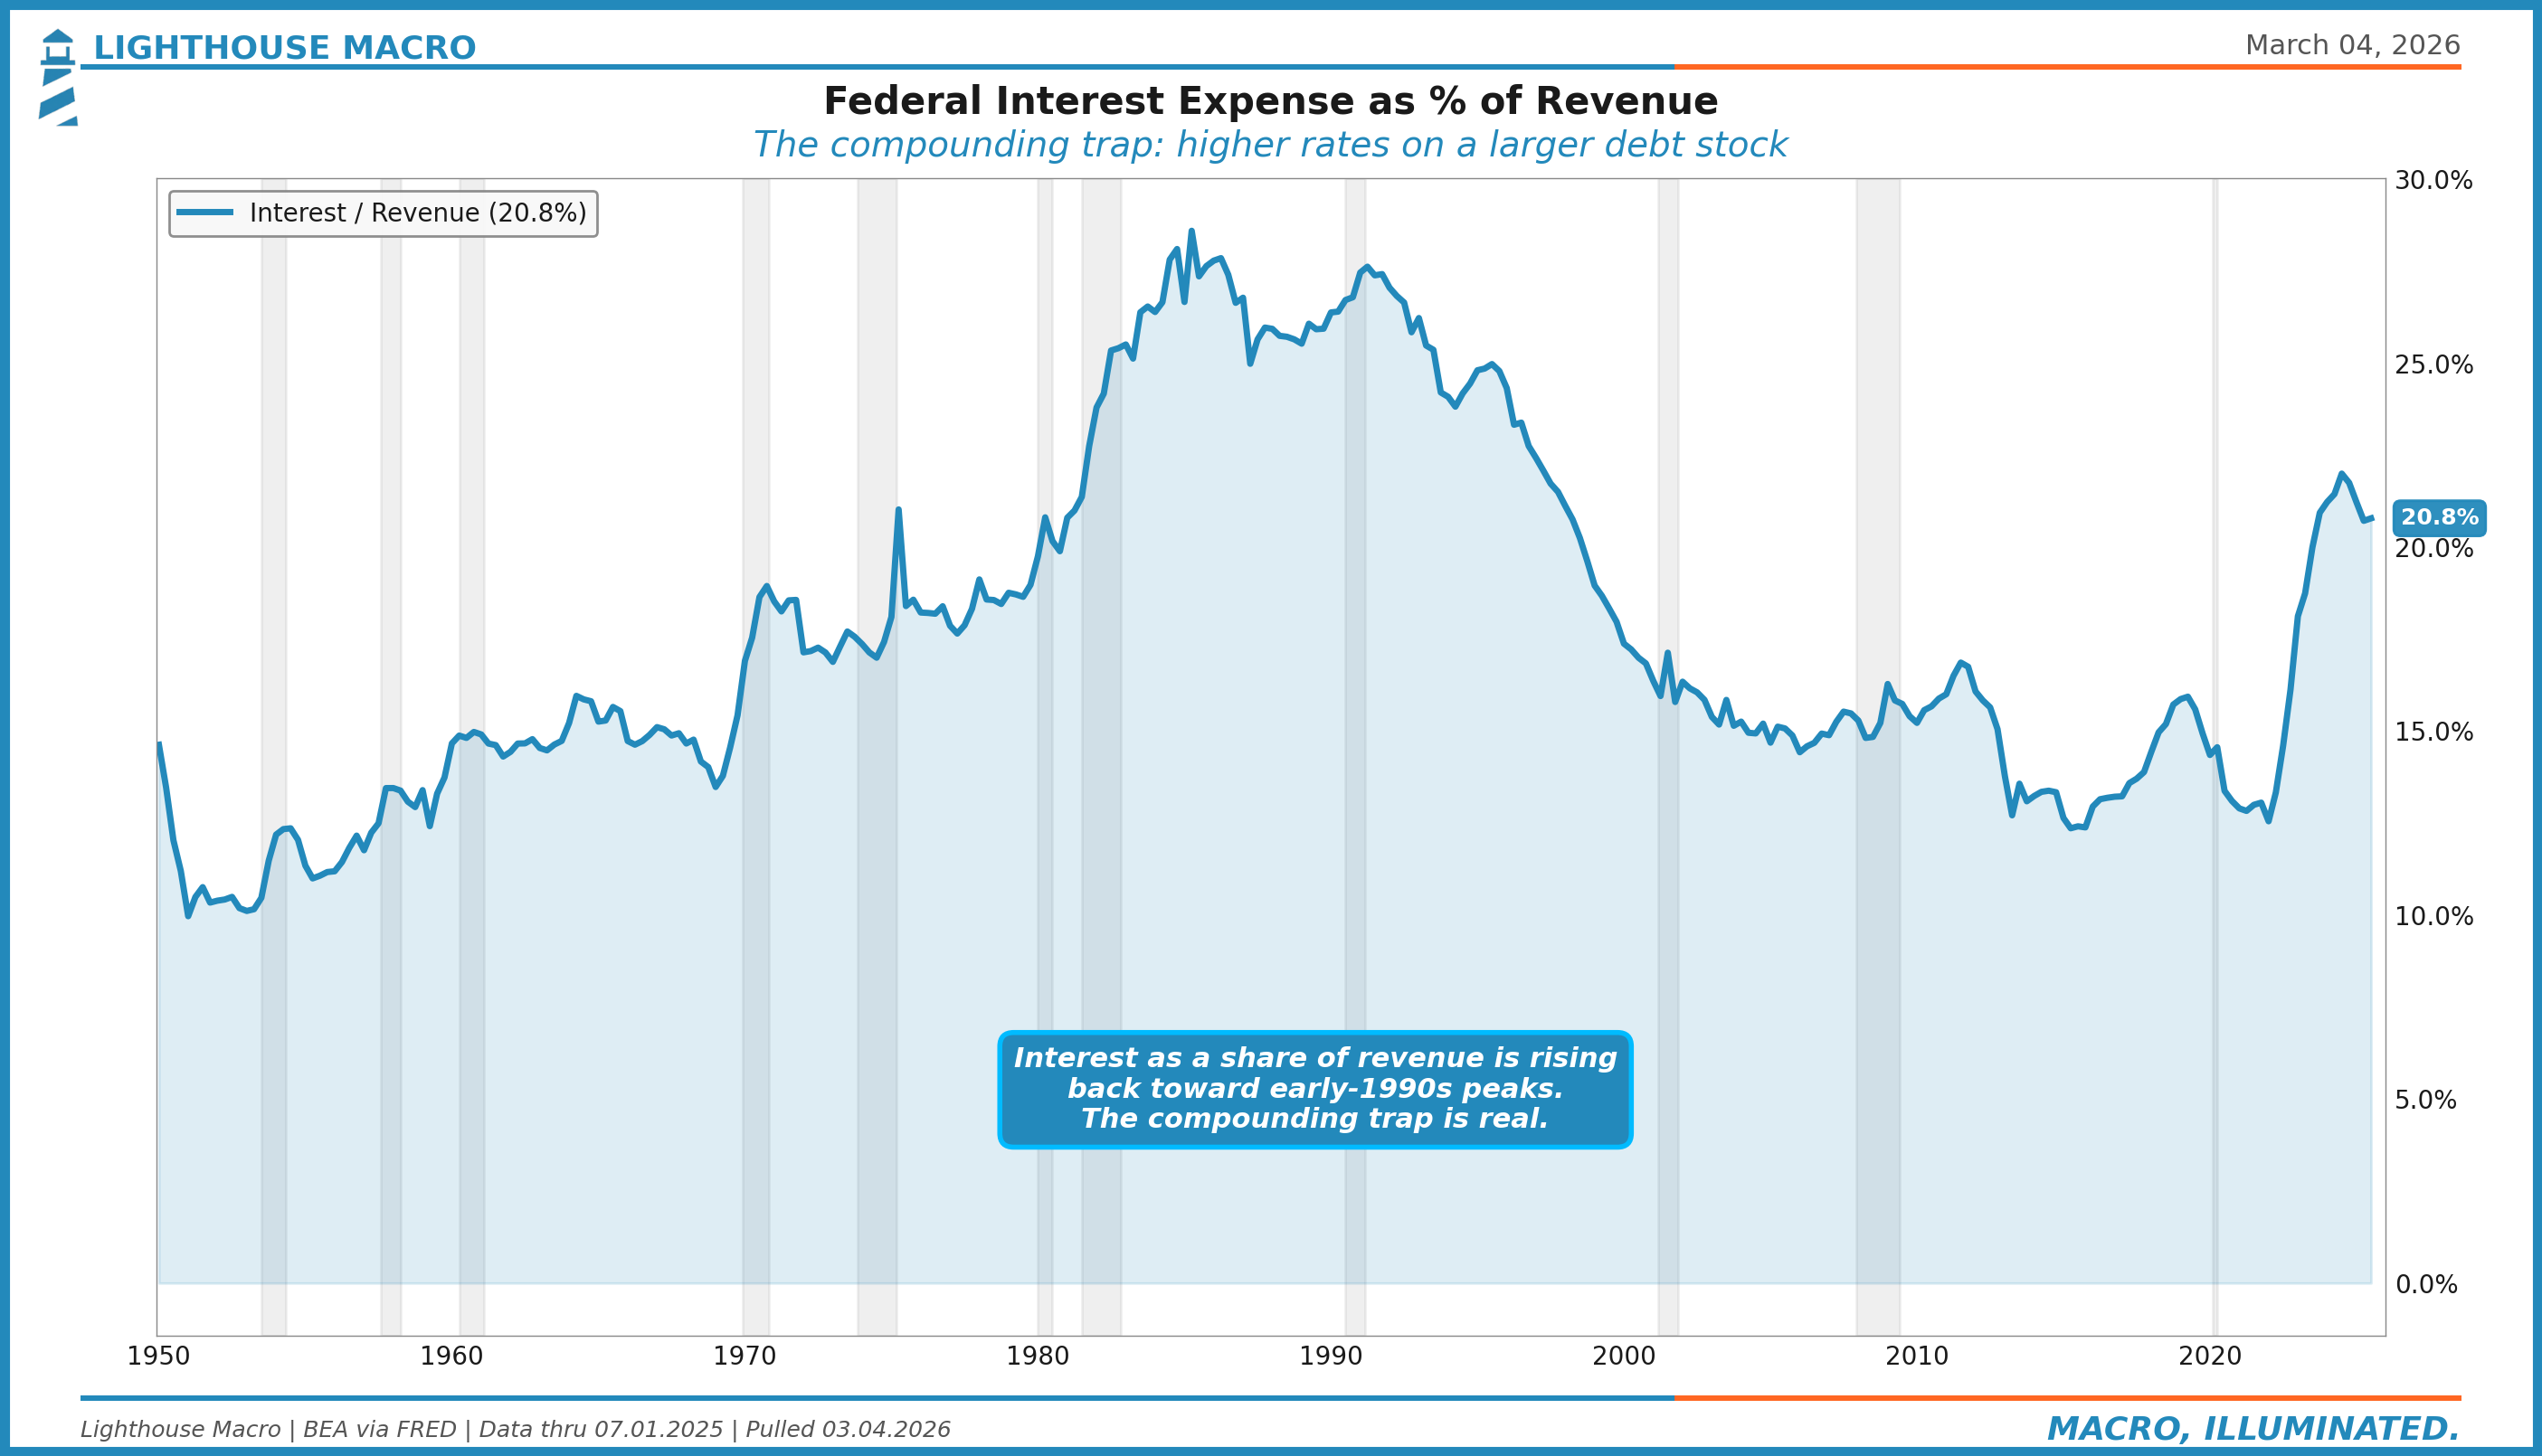
The compounding trap works like this: higher rates mean higher interest costs on new and rolling debt. Higher interest costs widen the deficit. A wider deficit requires more issuance. More issuance puts upward pressure on rates. Repeat. This is not a theoretical feedback loop. It is the arithmetic reality of a $38.5 trillion debt stock refinancing at rates 200-300 basis points higher than the blended average coupon.
In nominal terms, the picture is even starker.
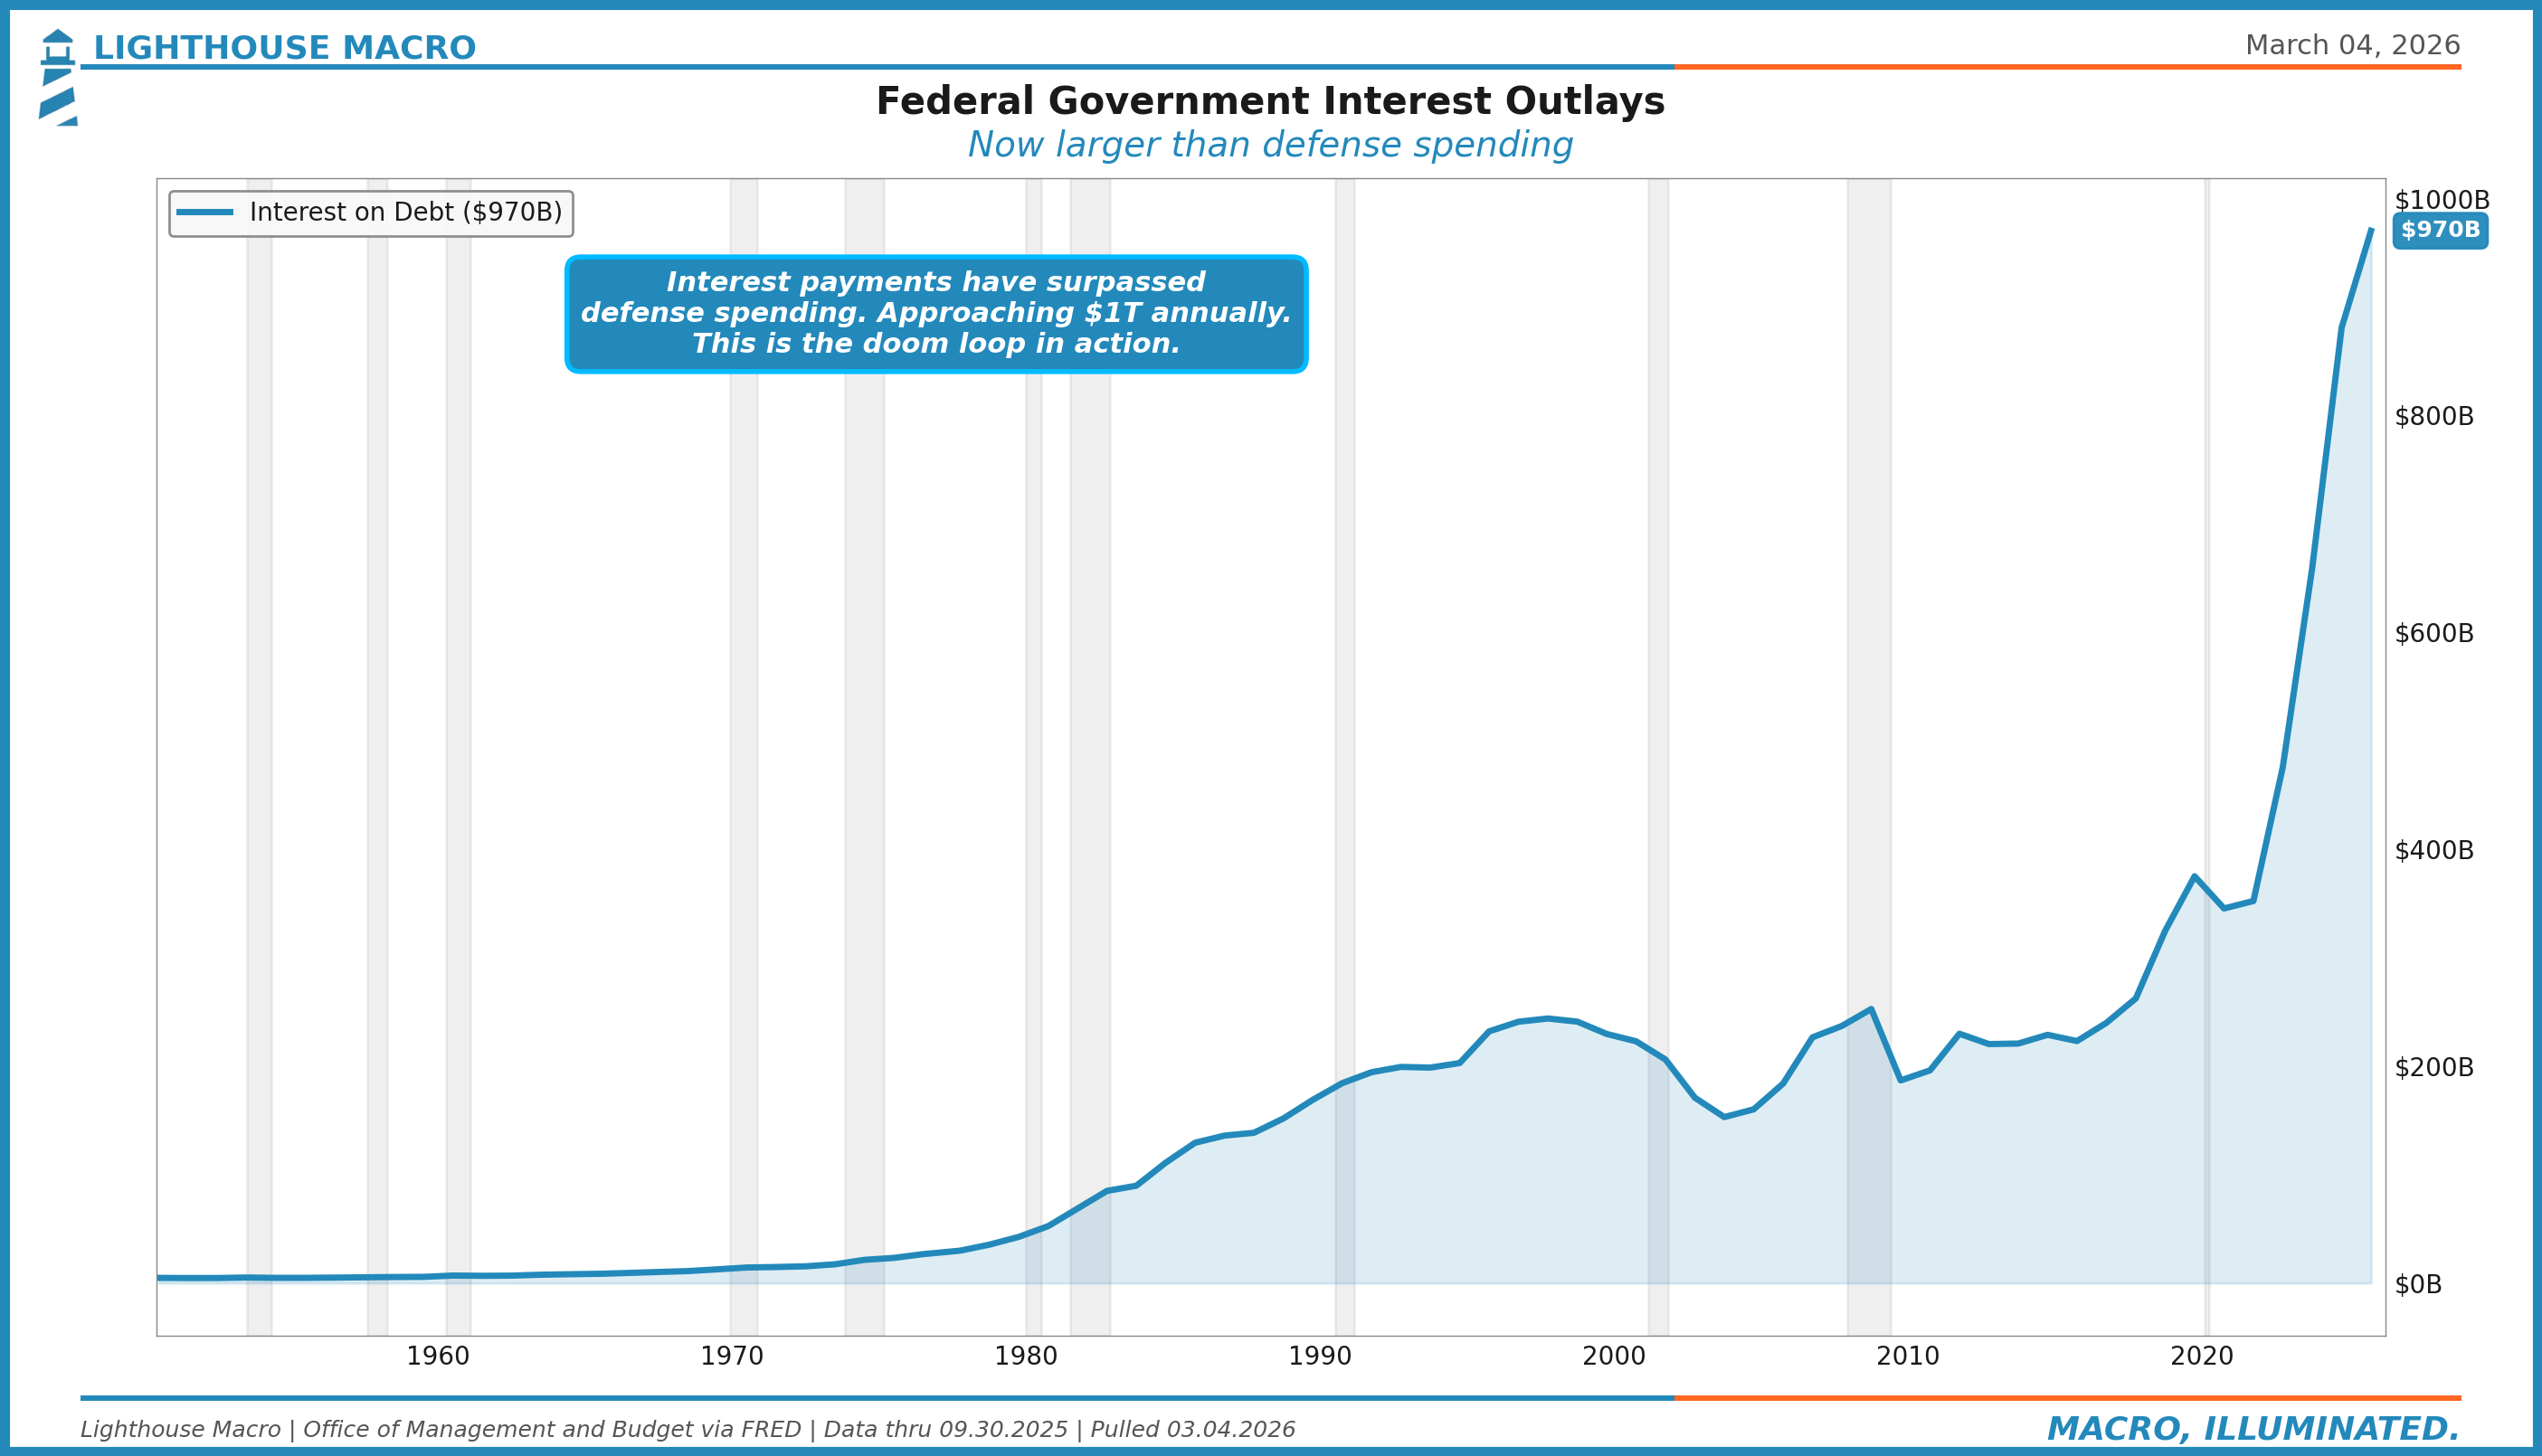
Federal net interest outlays hit $970 billion in FY2025, surpassing defense spending. On an annualized basis, the run rate has already crossed $1 trillion. The trajectory is not a function of policy choices. It is a function of the existing debt stock rolling over at higher rates. Even if the Fed cuts aggressively, the weighted average interest rate on outstanding debt will continue rising for years as old low-coupon debt matures and gets replaced at current rates.
Debt-to-GDP: The Trajectory Problem
Gross federal debt stands at 122% of GDP. The level itself is manageable. Japan runs above 250% and functions (though with very different dynamics: domestic savings surplus, current account surplus, and a captive buyer base through the Bank of Japan). The issue for the U.S. is not the level. It is the trajectory, combined with the fact that the U.S. relies on external financing and the marginal buyer is increasingly price-sensitive.
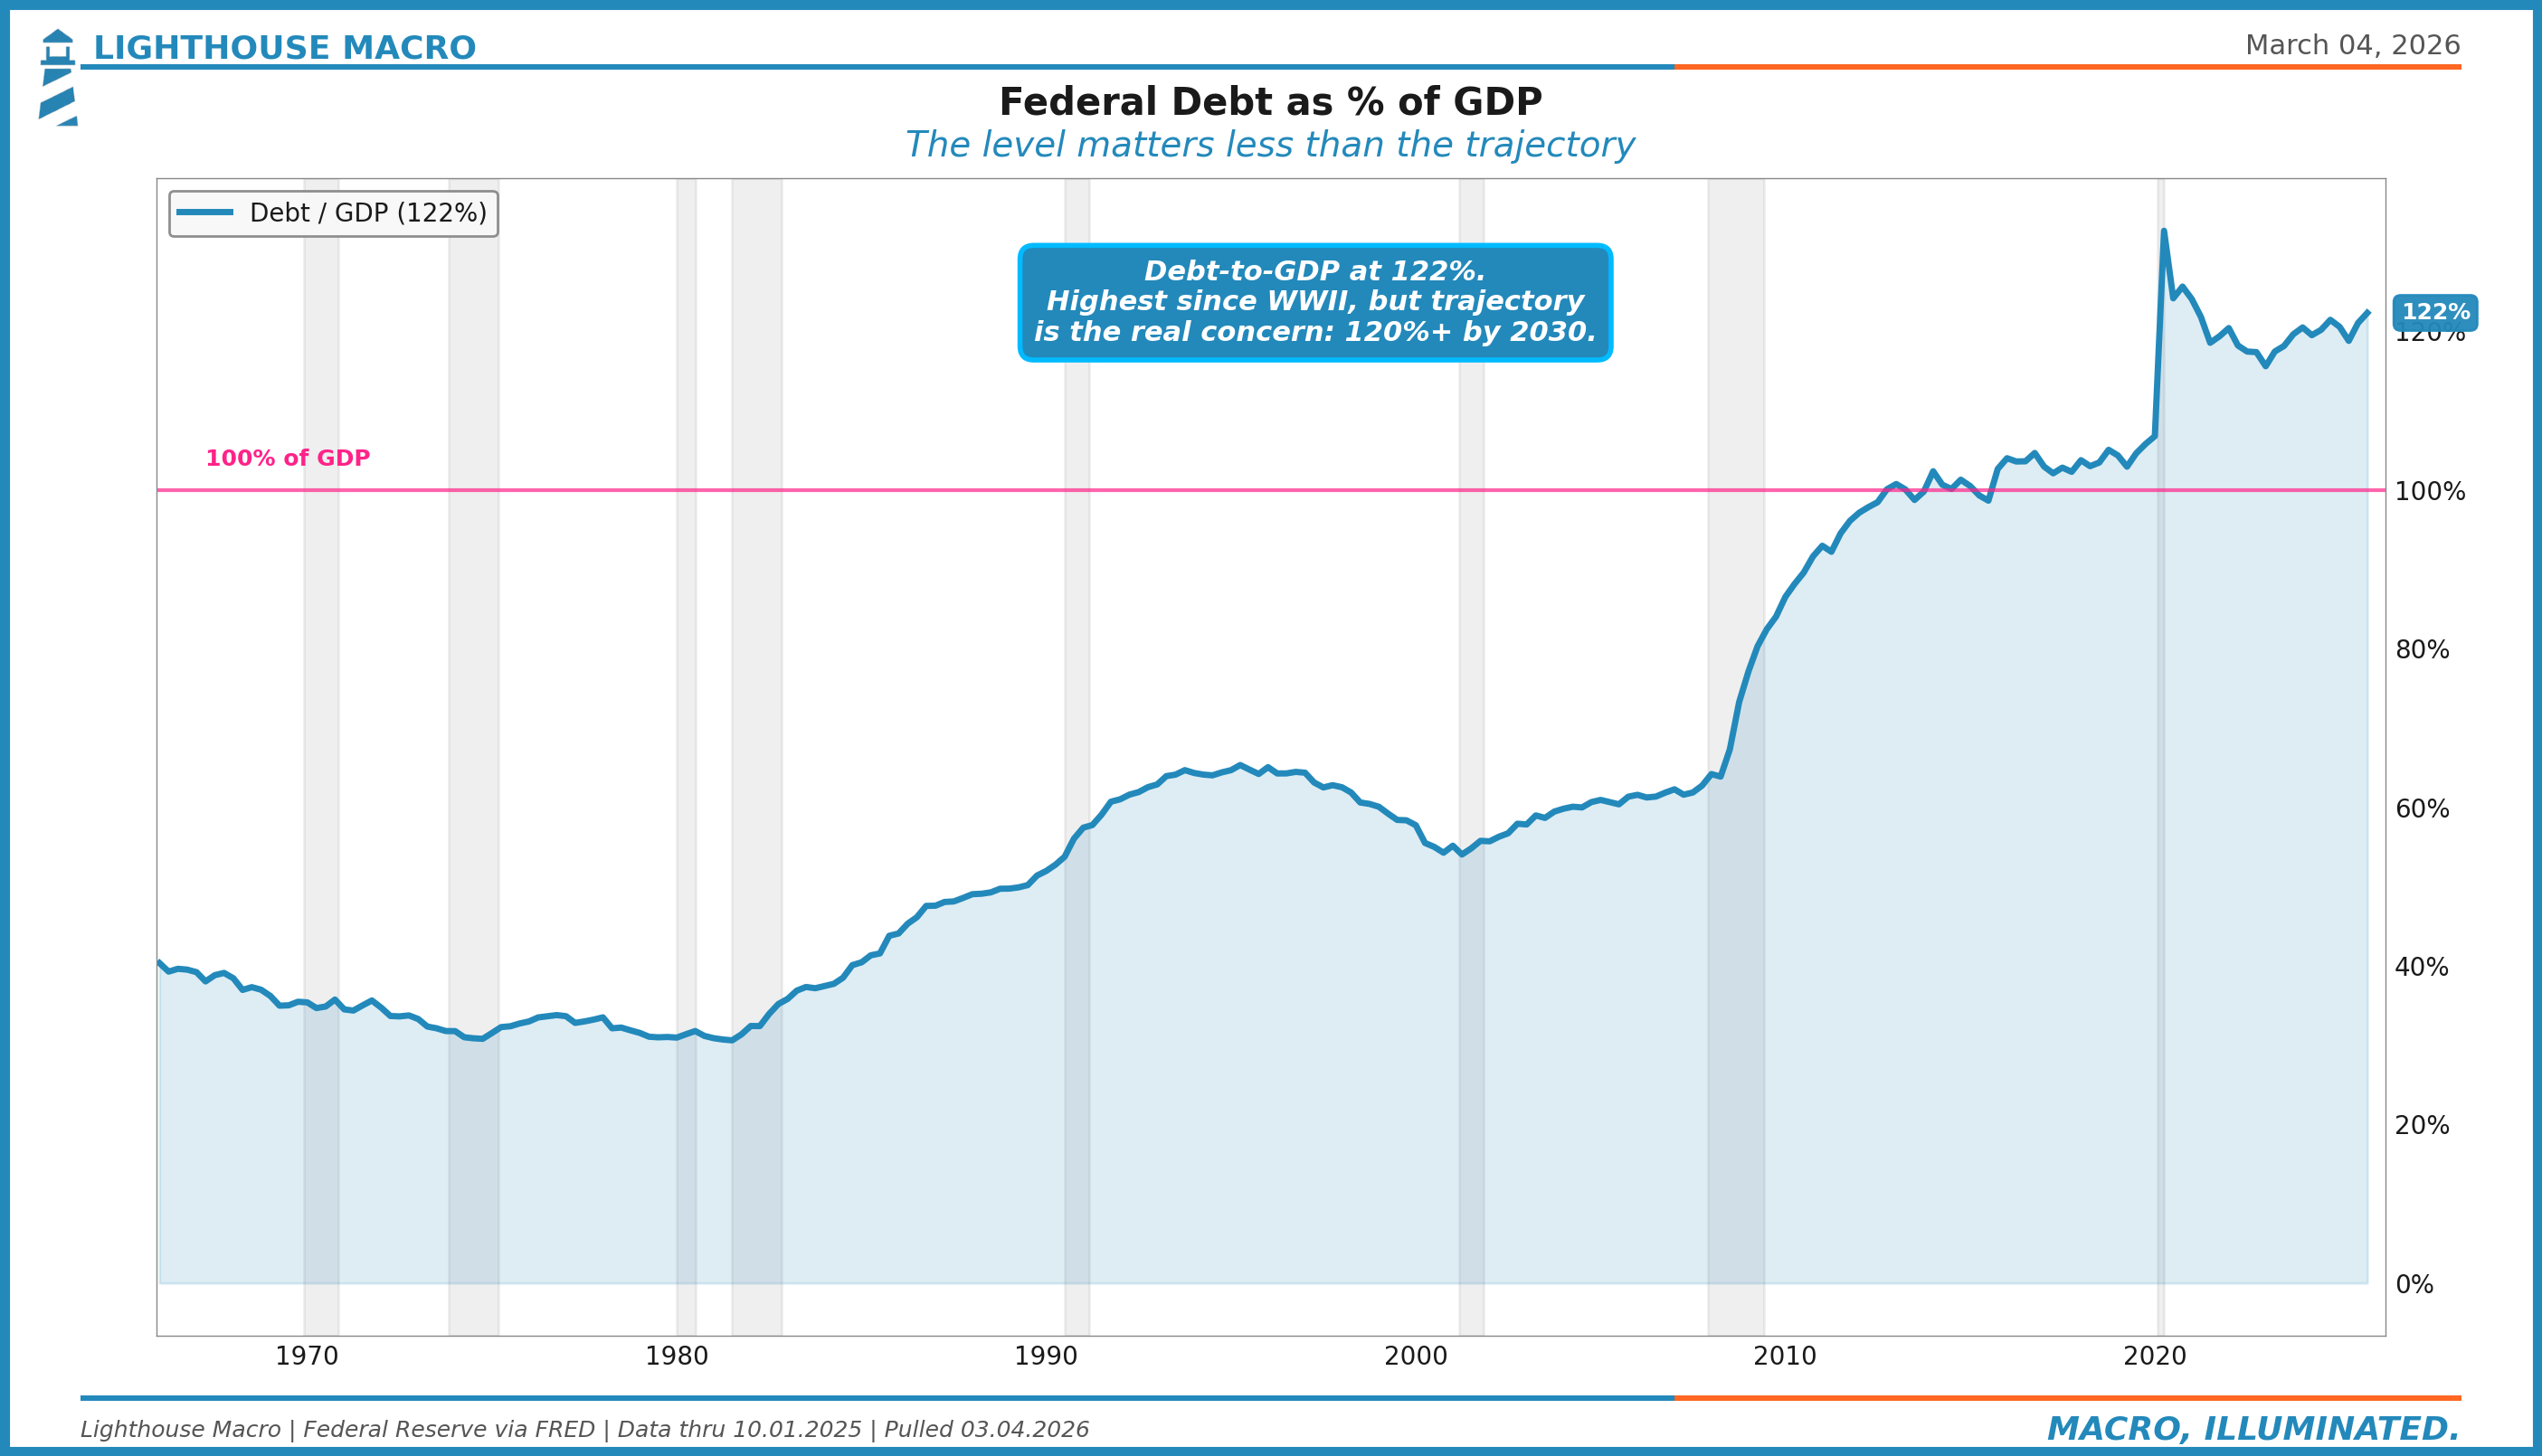
The ratio briefly spiked to 133% in Q2 2020 during the pandemic emergency, then fell as GDP rebounded. At 122%, it has now re-established an upward trajectory that the One Big Beautiful Bill Act (OBBB) will steepen. CBO scored OBBB at $3.4 trillion in additional deficits over ten years, with outside estimates ranging to $6 trillion depending on extension assumptions. Pre-OBBB, CBO’s January 2025 baseline projected debt held by the public reaching 118% of GDP by 2035. Post-OBBB, the trajectory is materially worse. The pandemic spike came down because GDP surged and emergency spending stopped. Neither condition applies to the structural deficit path ahead.
Fiscal Impulse: The Second Derivative of Government Spending
The impulse matters more than the level for growth. A fiscal impulse measures the year-over-year change in the deficit: positive means the government is adding more demand to the economy than it did last year (stimulative), negative means it is adding less (contractionary). A deficit going from 7% to 5% is contractionary even though it is still a deficit.
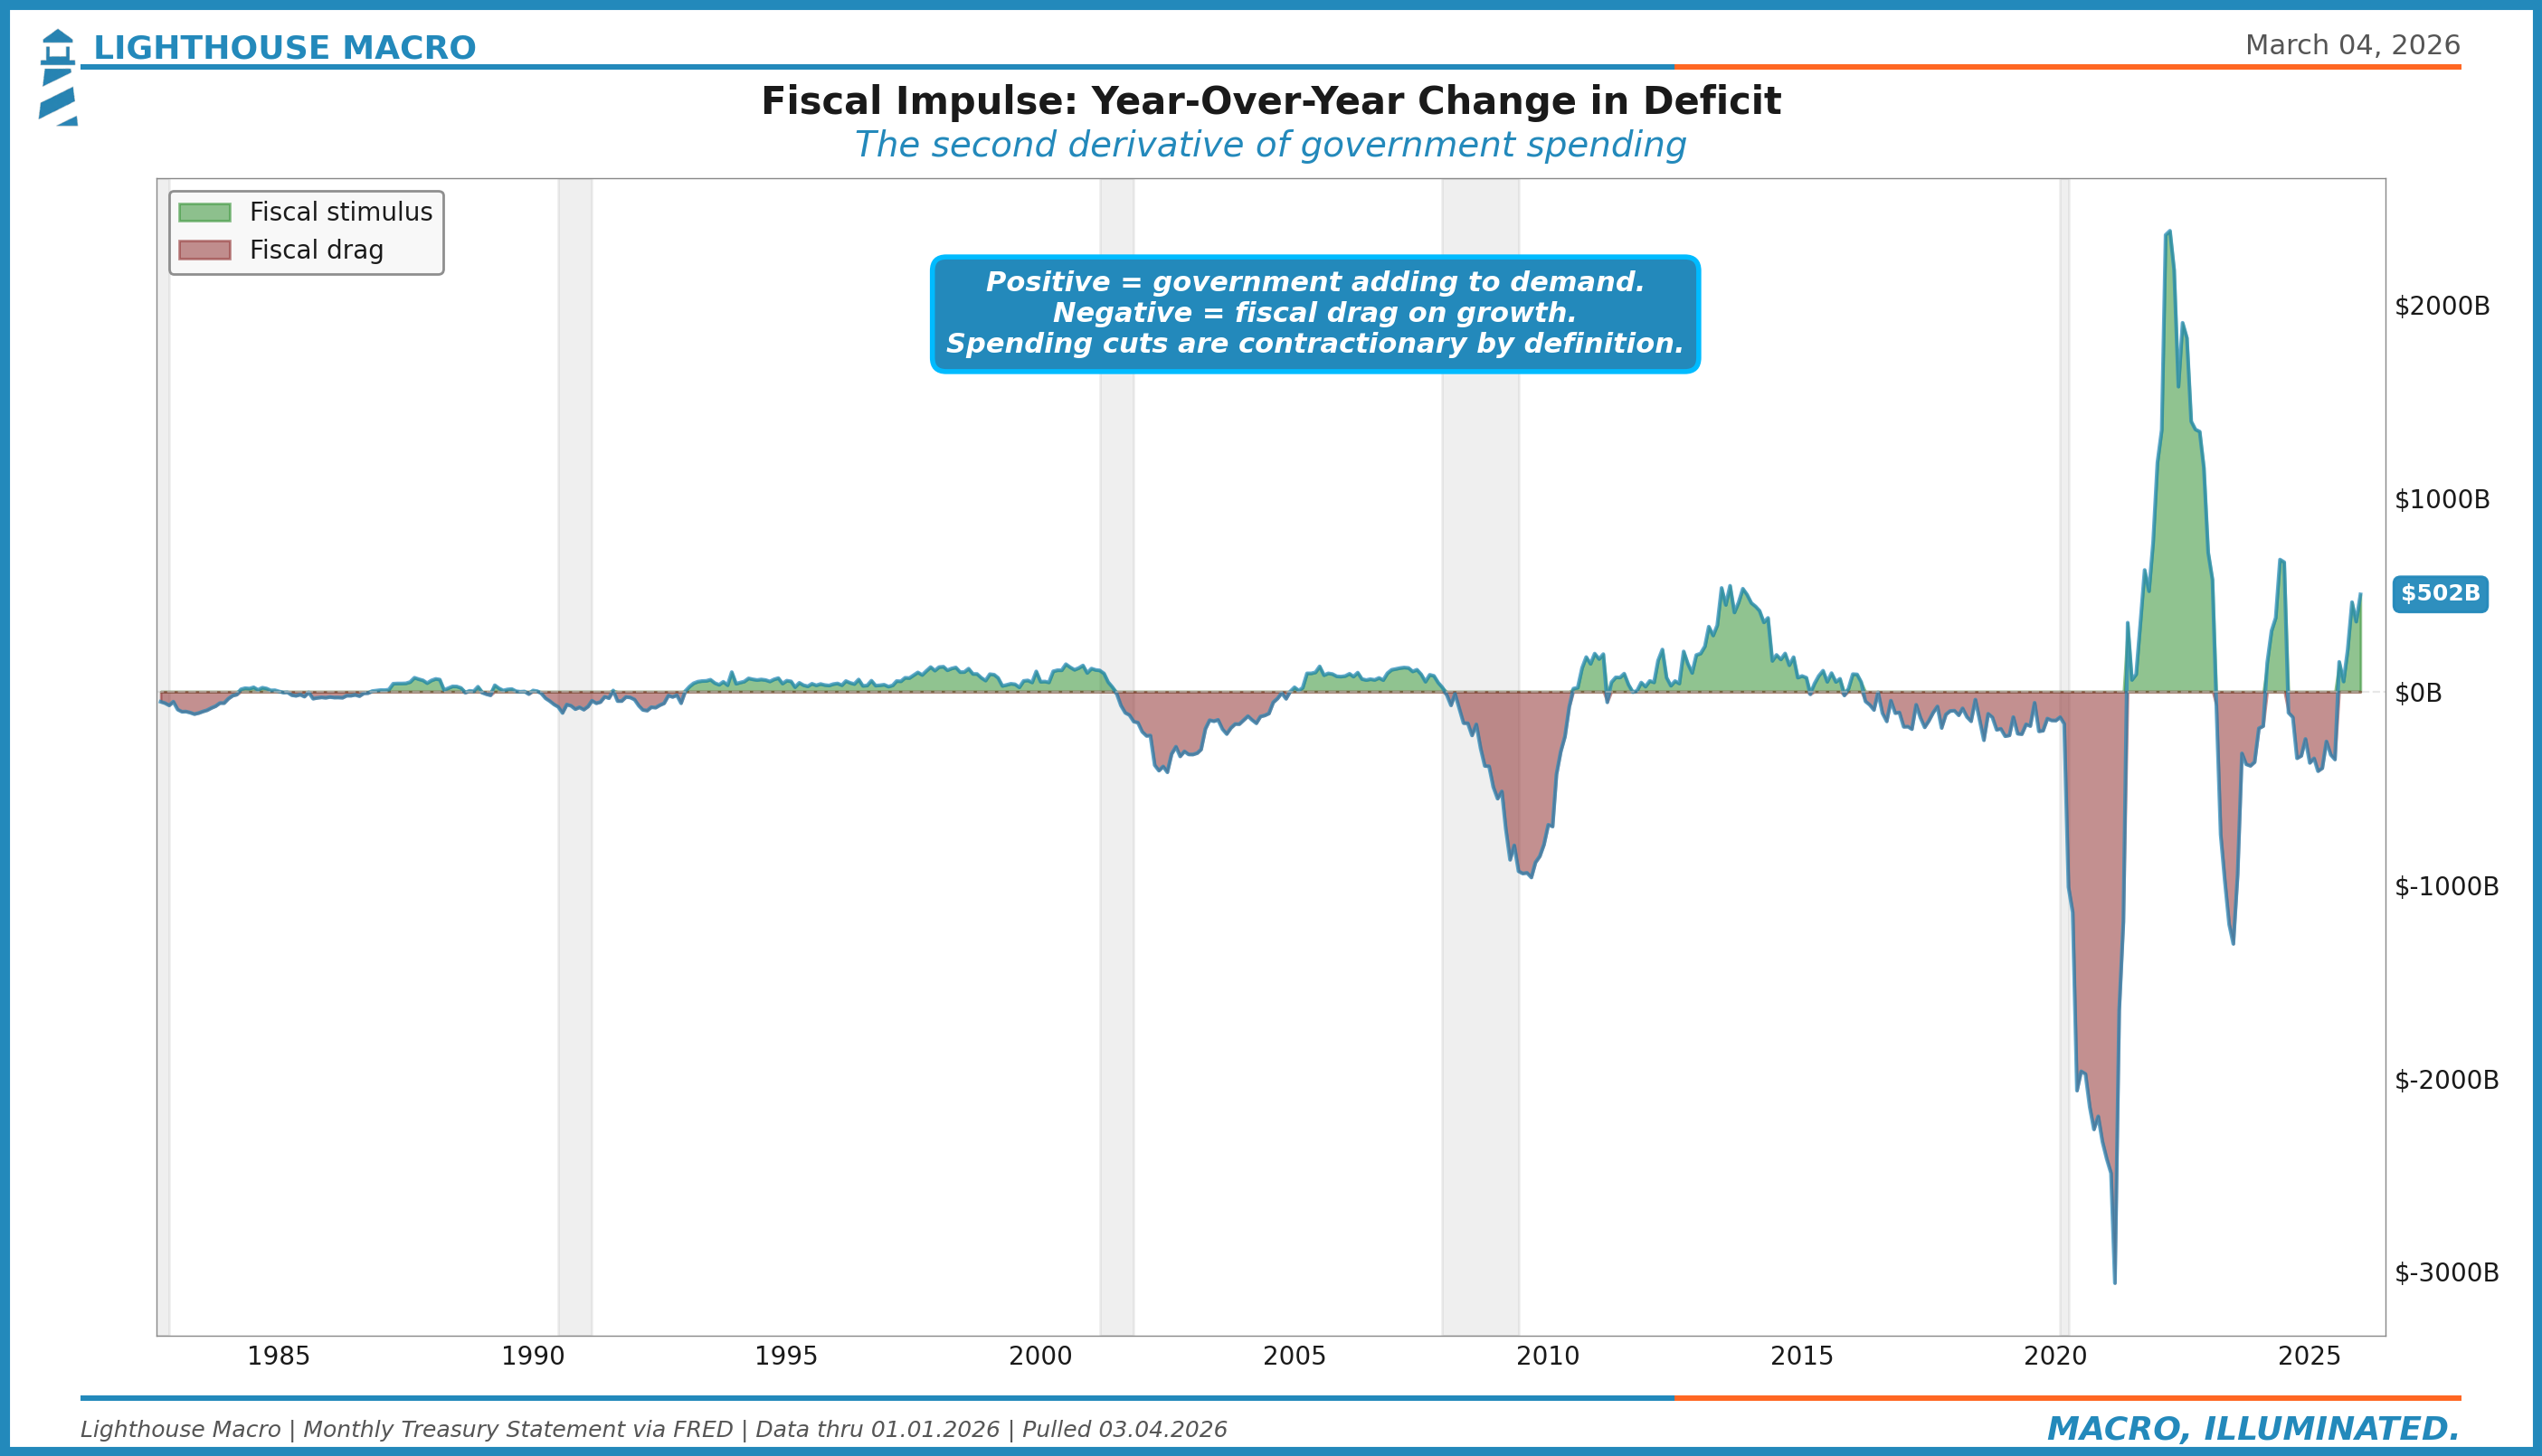
On a trailing 12-month basis through January 2026, the fiscal impulse is positive at roughly $502 billion, meaning the government is running a larger deficit over that window than the prior 12 months. For context, outside of the 2020-2021 emergency spending ($3-4 trillion swings), a $500 billion impulse is among the largest in modern history. Note: on a full fiscal year basis, FY2025 ($1,776B deficit) actually narrowed slightly from FY2024 ($1,828B), so the impulse reading depends on the measurement window. The trailing 12-month measure captures the most recent direction. For the framework, this creates a tension: if spending reforms actually materialize, the fiscal impulse turns negative, and that reversal hits GDP growth directly.
GCI-Gov Composite: Fiscal Stress in a Single Number
The Government Conditions Index synthesizes the indicators above into a single composite reading. Positive values indicate rising fiscal stress. Negative values indicate improving fiscal conditions.
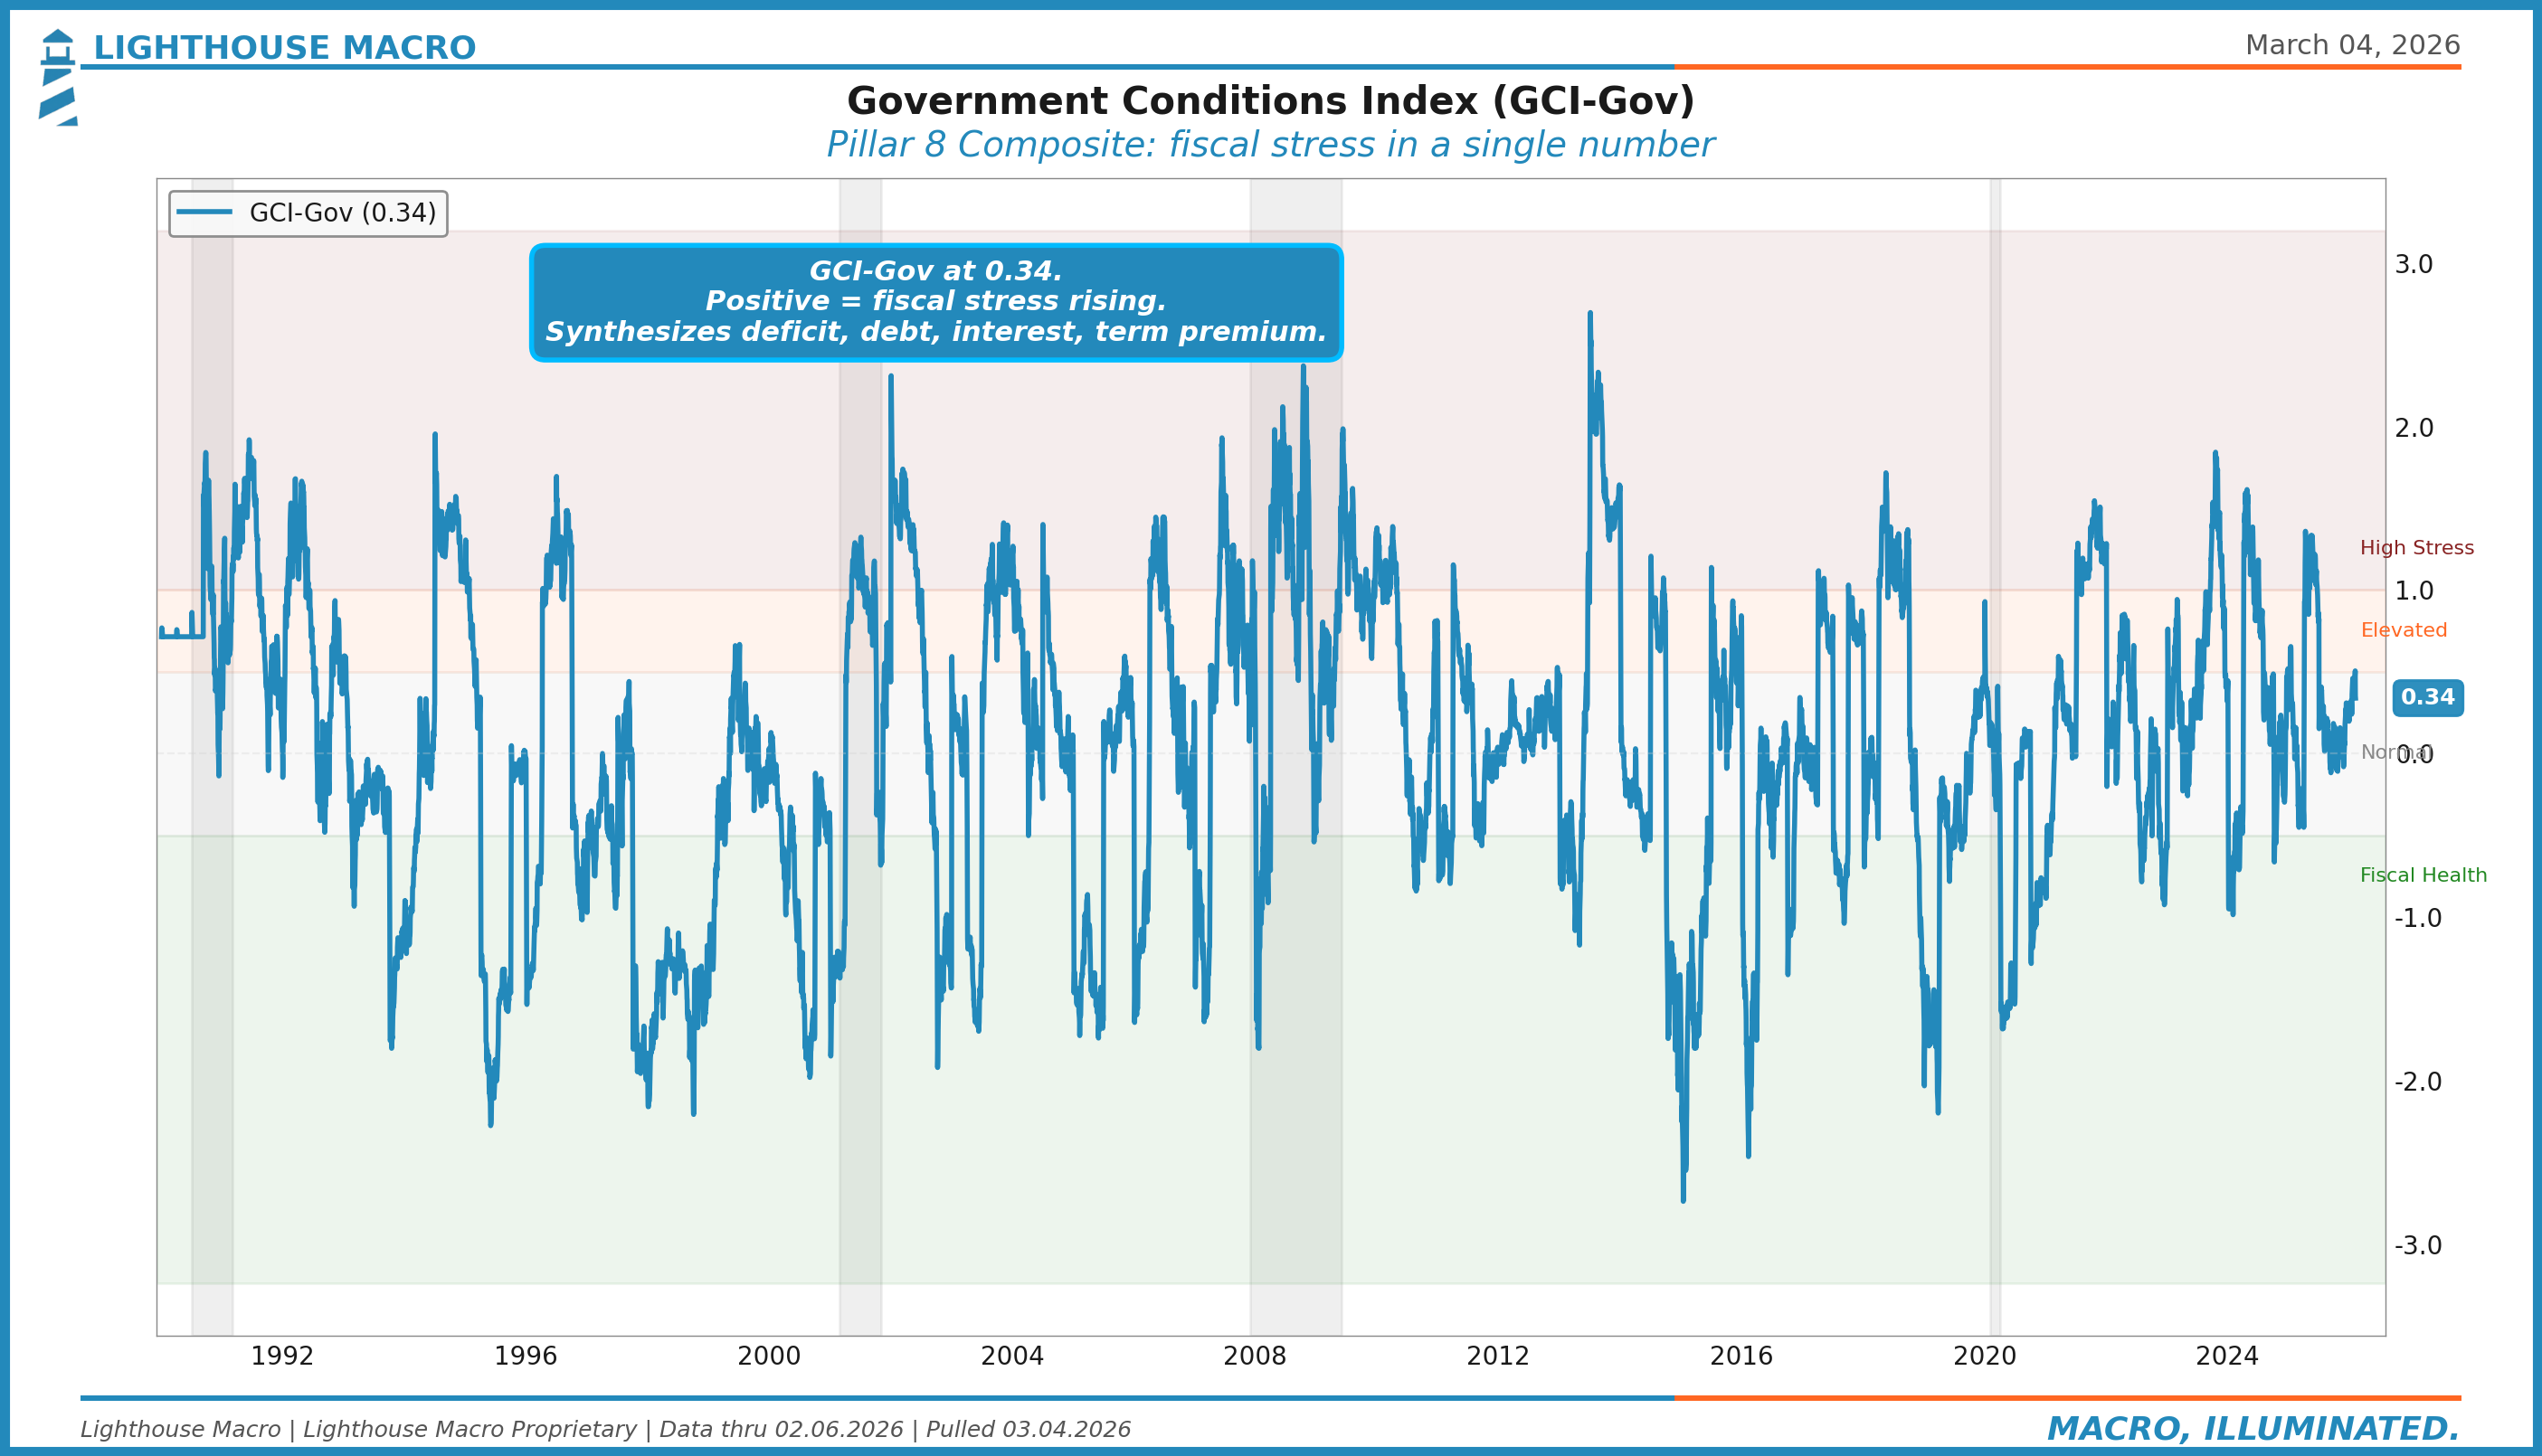
GCI-Gov at +0.34 sits in the normal range but has been volatile. The composite captures the tension between deteriorating fiscal fundamentals (deficit, debt, interest burden) and the market’s willingness to absorb it (term premium, auction demand). When GCI-Gov sustains above +1.0, we initiate steepener trades and reduce duration exposure. The current reading says the market has not yet fully priced the fiscal trajectory, which is consistent with our view that term premium repricing is still ahead.
Foreign Holdings: The Changing Buyer Base
The share of gross federal debt held by foreign investors peaked around 34% in 2013-2014 and has been declining steadily. At 24.6%, foreign governments and institutions hold a smaller share of a much larger debt stock. The absolute level of foreign holdings has grown, but not nearly as fast as total issuance.
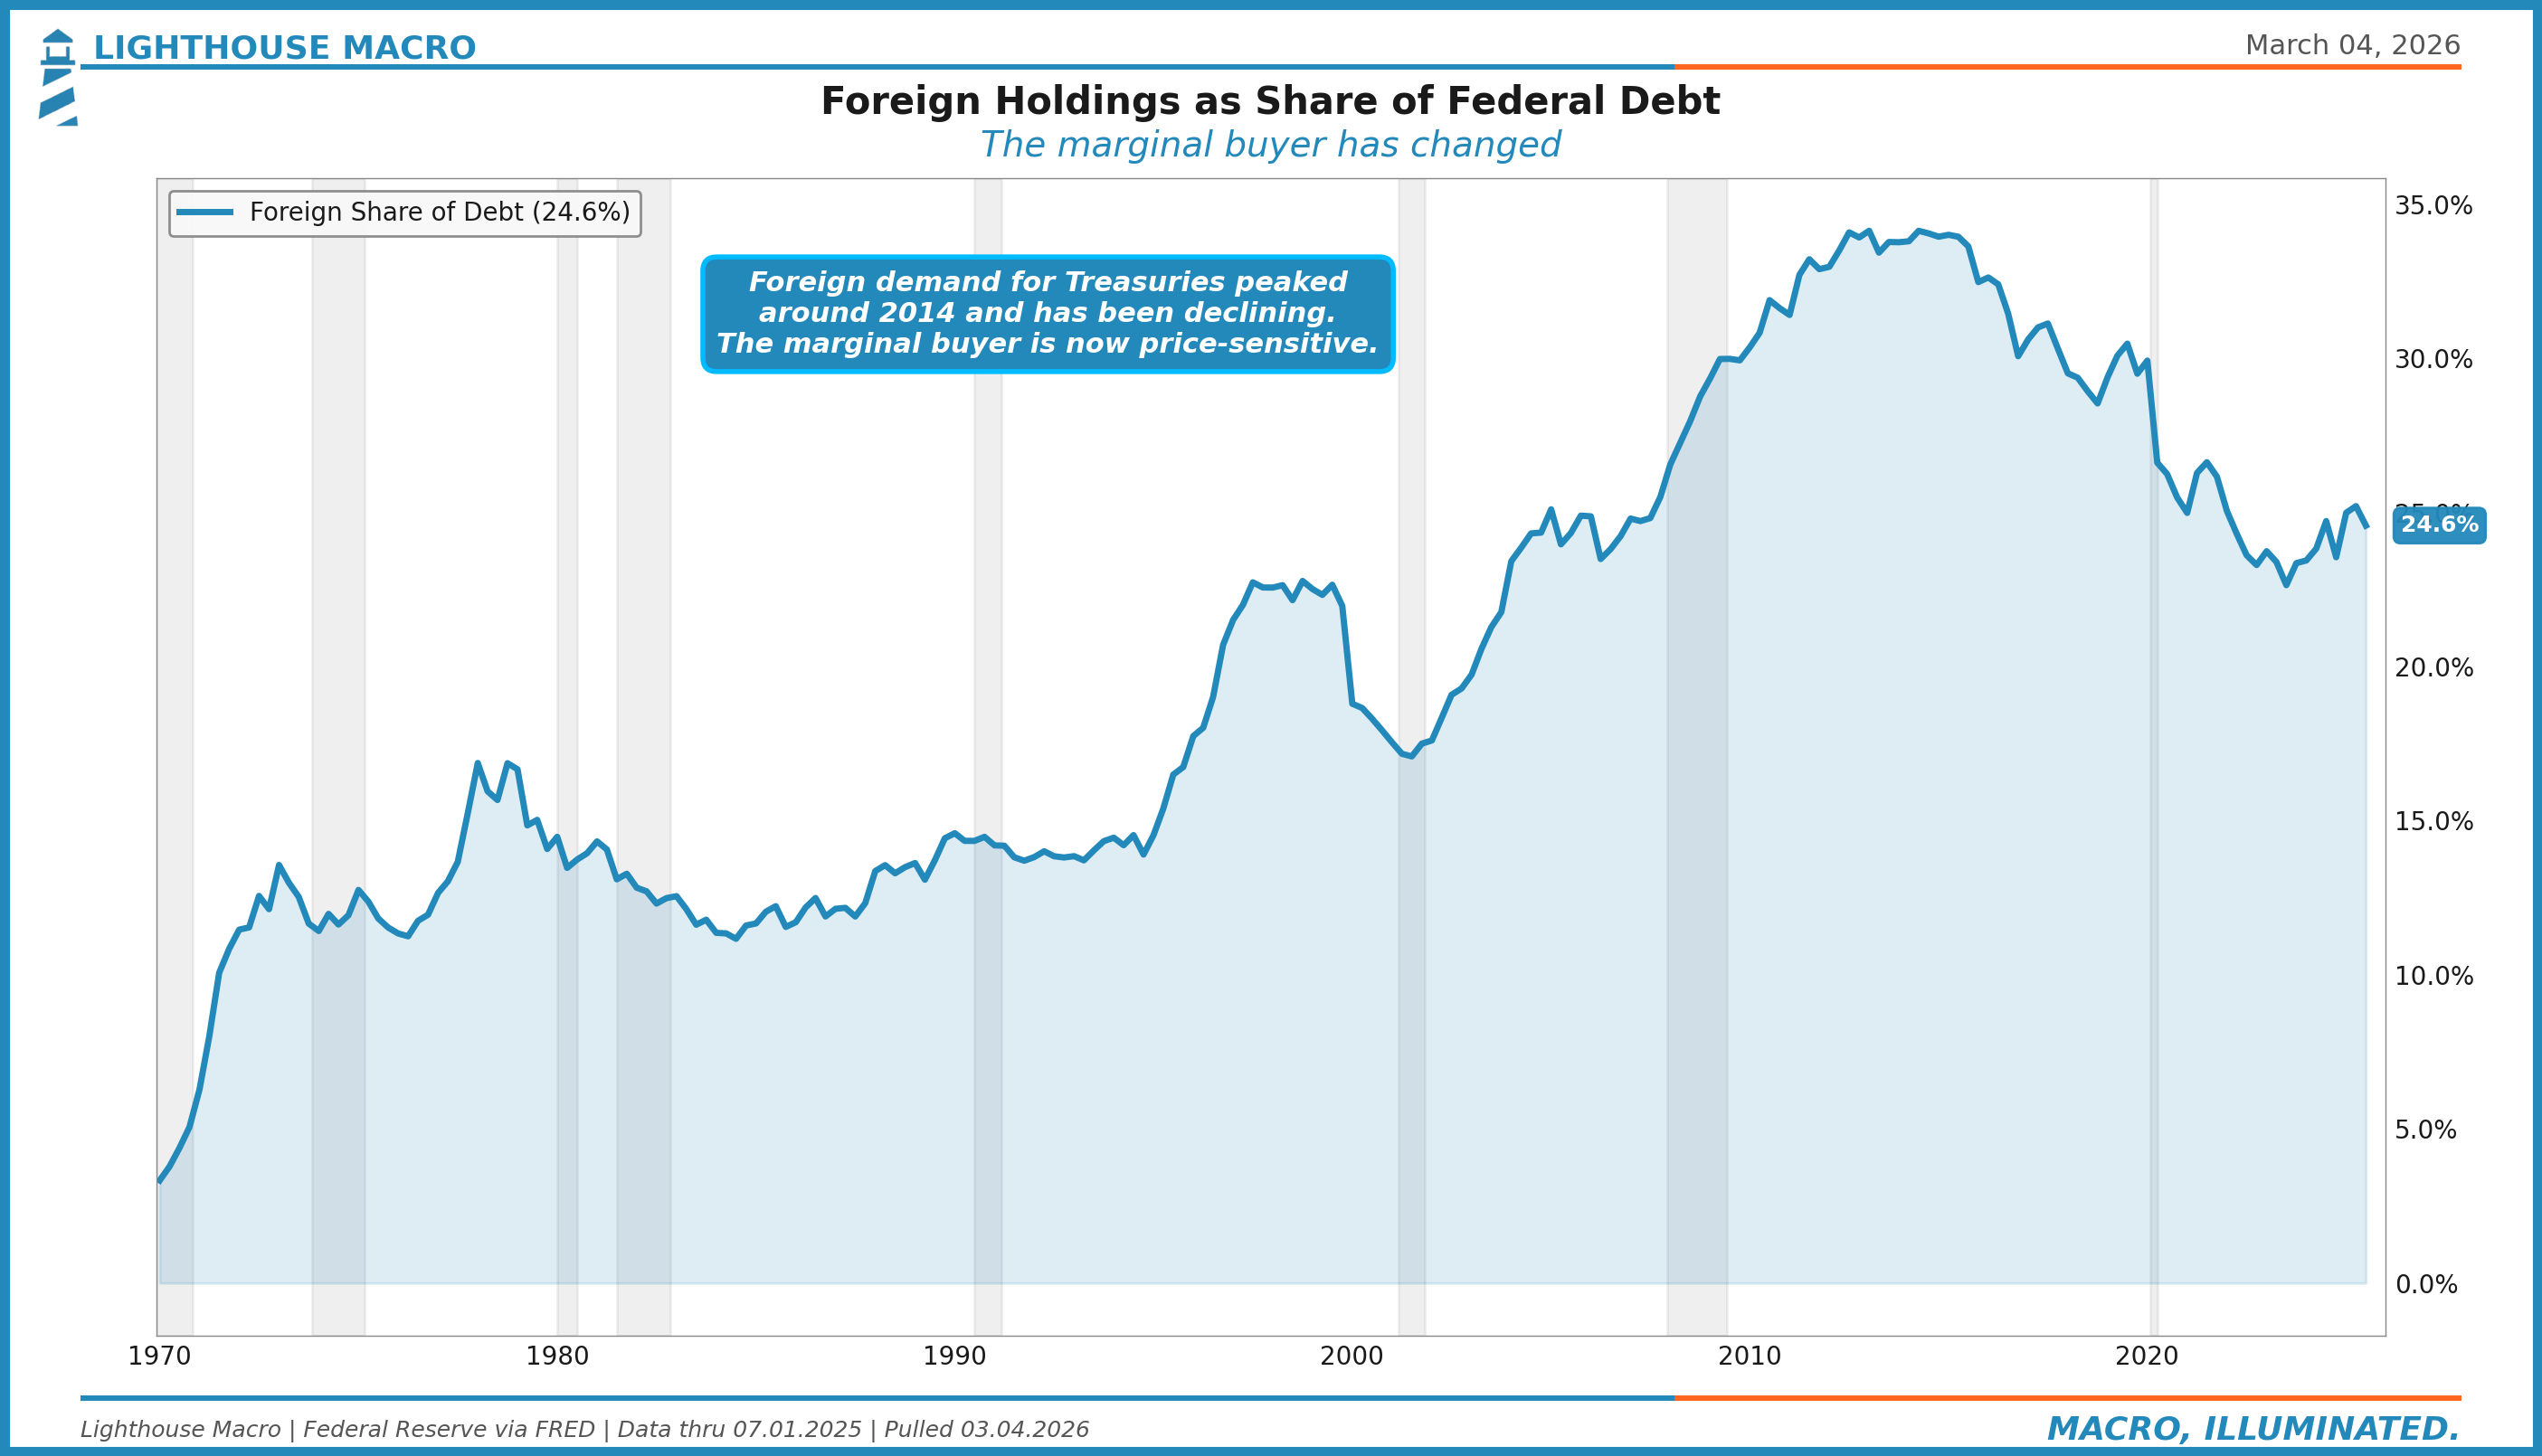
This matters for the term premium story. When the Fed was buying and foreign central banks were accumulating reserves in Treasuries, the marginal buyer was price-insensitive. They bought because they needed to, not because the yield was attractive. Now both of those flows have reversed: the Fed is running QT and foreign central bank reserve accumulation has slowed. The marginal buyer today is a domestic asset manager, a hedge fund, or a pension fund. They demand compensation. That compensation is term premium.
Receipts vs. Outlays: The Structural Gap
The cleanest visual of fiscal dominance is simply plotting what the government collects against what it spends. The gap between receipts and outlays is the deficit. When that gap widens persistently outside of recession, you are looking at a structural problem.
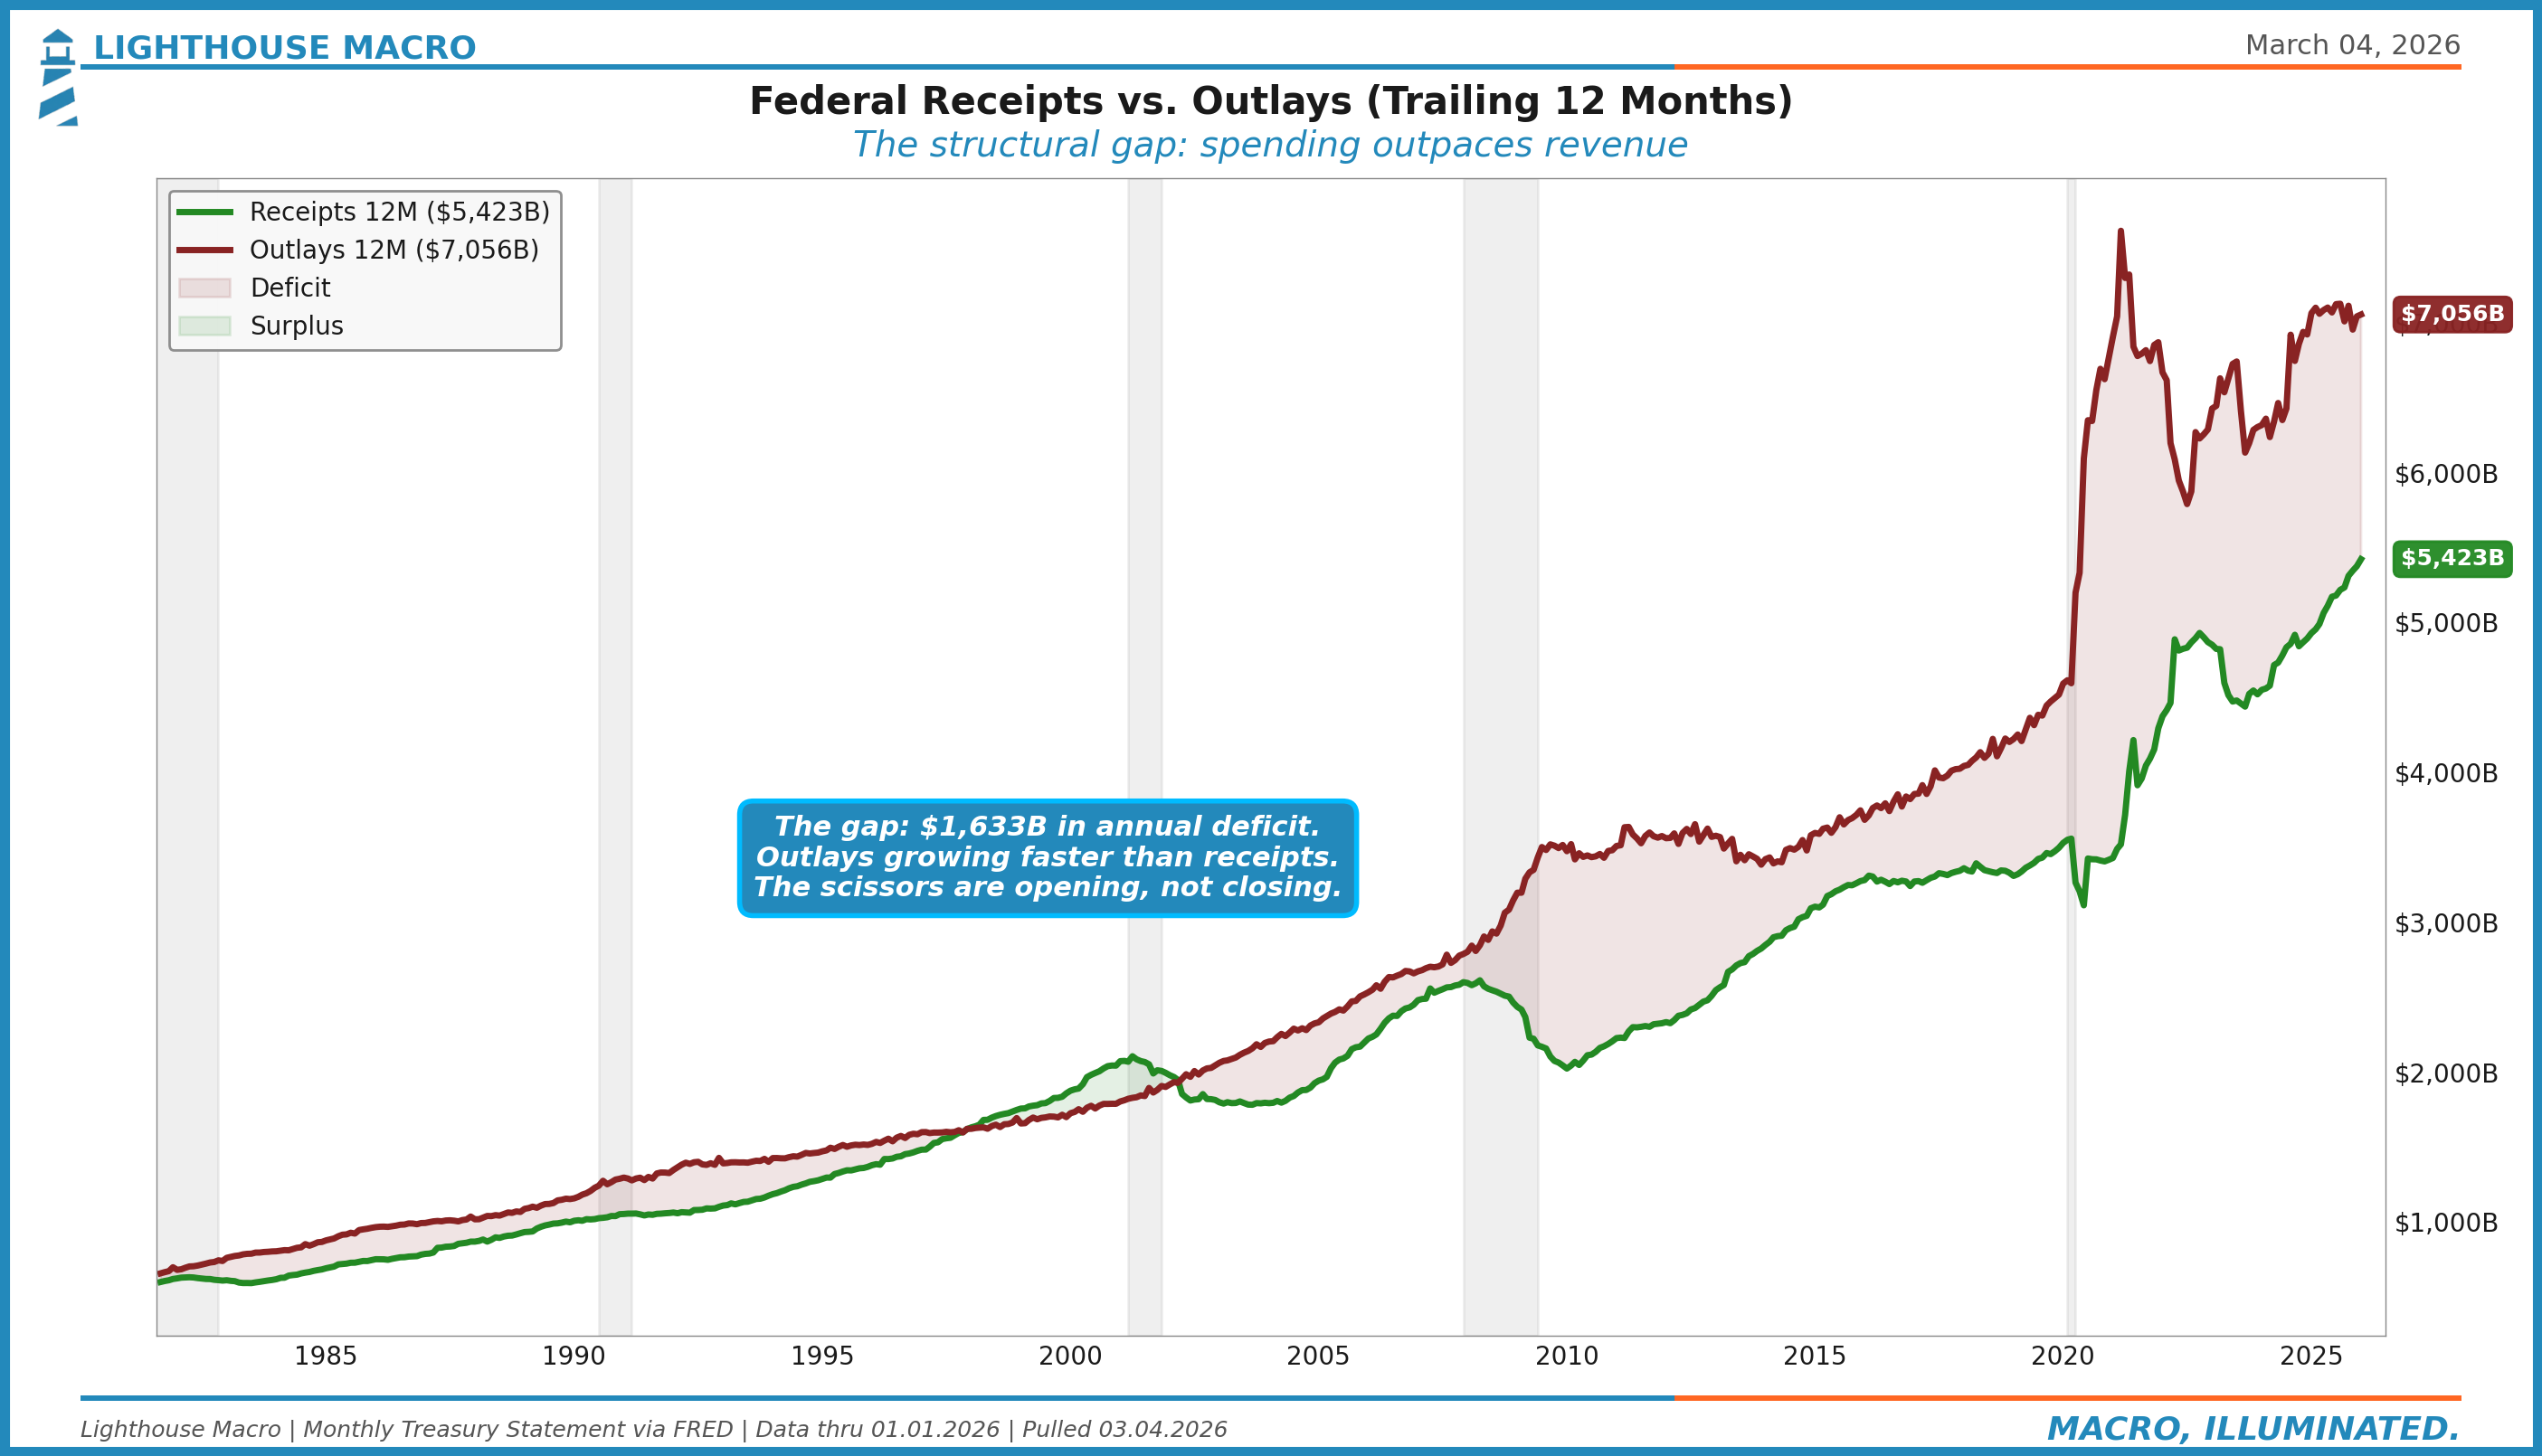
The scissors are opening, not closing. Receipts at $5.4 trillion are near record highs. The government is not suffering a revenue problem. Outlays at $7.1 trillion are simply growing faster. Mandatory programs plus interest expense are the drivers. This chart tells the whole story without a single ratio or z-score: the government collects more than ever and still cannot keep up with what it spends.
The Consensus Trap
“Deficits don’t matter because the U.S. can always print.”
The U.S. can technically always fund itself. It issues debt in its own currency and the Fed can, in extremis, monetize. But the cost of funding matters. When term premium reprices, it tightens financial conditions without the Fed lifting a finger. The “deficits don’t matter” crowd confuses solvency with sustainability. The U.S. will not default. But it can absolutely suffer a fiscal premium that compresses equity multiples, widens credit spreads, and crowds out private investment. That is not a theoretical risk. It is the base case for the next five years.
“DOGE and spending cuts will fix this.”
The math. Discretionary spending is roughly $1.7 trillion. Mandatory spending (Social Security, Medicare, Medicaid, interest) is roughly $4 trillion and growing on autopilot. You cannot cut your way to balance through discretionary alone. And the political will to touch mandatory spending does not exist. The cuts being discussed are a rounding error on the structural problem. Worse, if they actually materialize, the fiscal impulse turns negative and hits near-term growth. The long-term benefit is real but the short-term cost is contractionary. Watch actual appropriations, not headlines.
Where We Are Now
Current readings across the Government framework:
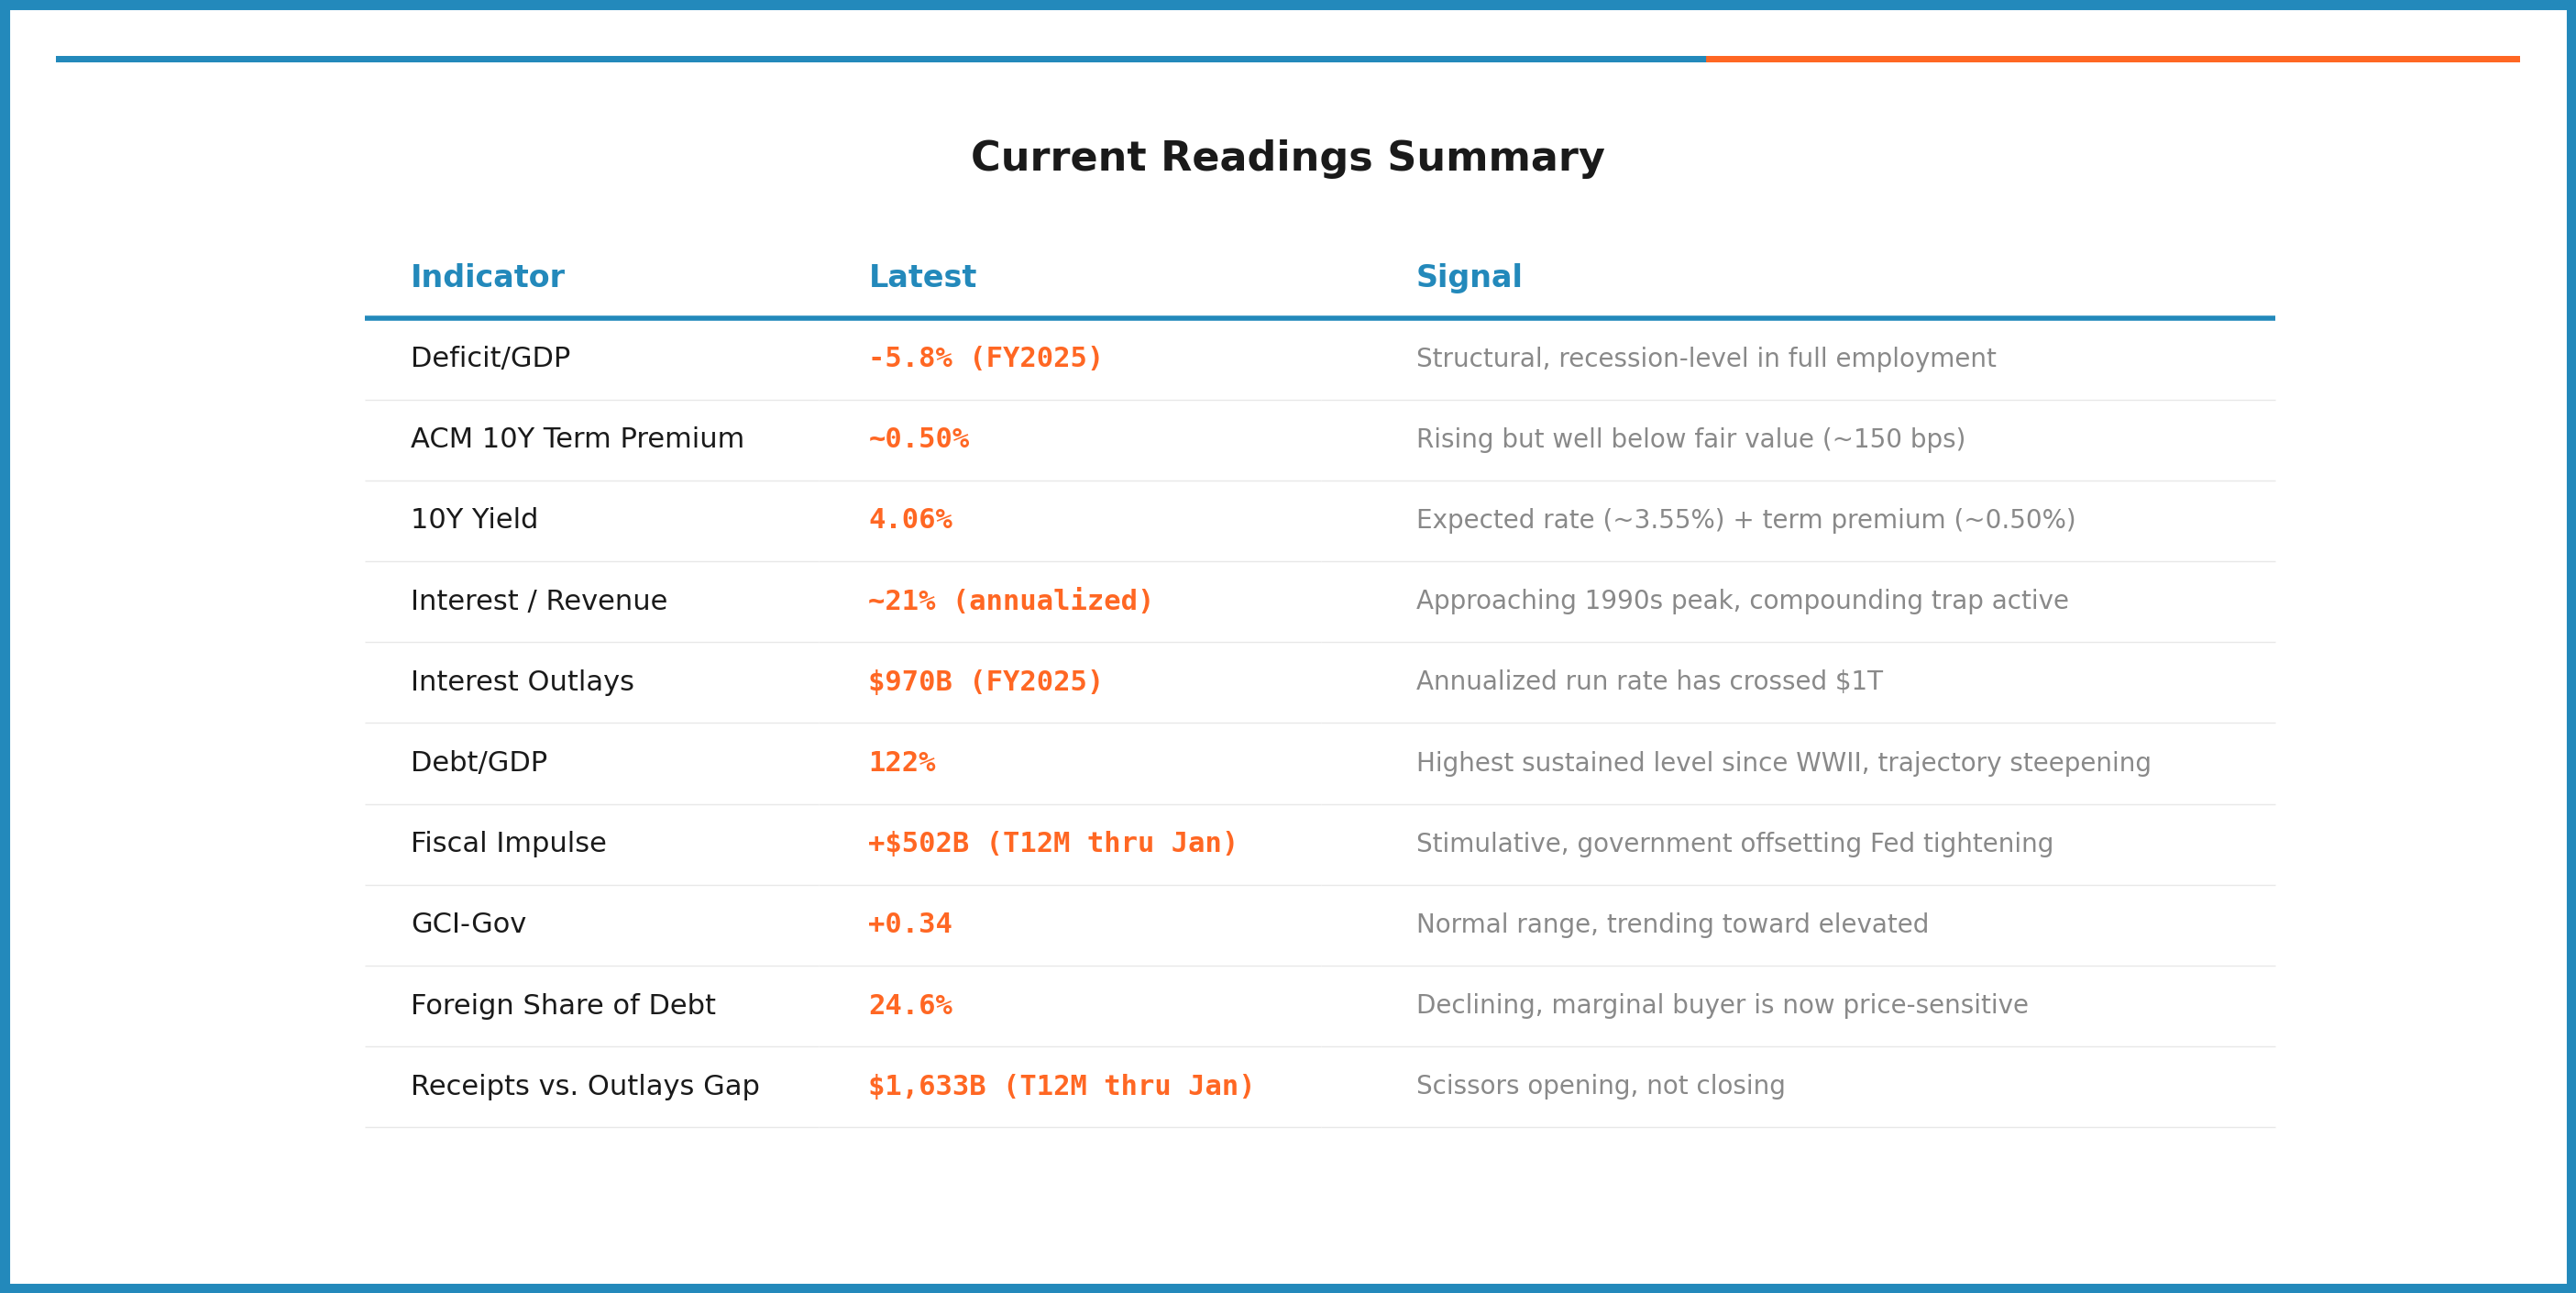
Three developments in recent months have made the structural story worse, not better. Moody’s stripped the U.S. of its last remaining AAA rating in May 2025, joining S&P (2011) and Fitch (2023). All three major agencies now rate the U.S. below prime. The One Big Beautiful Bill Act, signed in July 2025, added an estimated $3.4 trillion to 10-year deficits per CBO scoring. And as of late February 2026, the U.S. is funding Operation Epic Fury, a new military commitment, while already running 6% deficits. The structural story we have been building through this piece just got a real-time stress test.
Net assessment: The fiscal picture is structurally deteriorating but the market has not fully priced it. Term premium around 50 basis points is too low for a government running 6% deficits, 122% debt-to-GDP, and $1 trillion-plus in annualized interest with a declining foreign buyer base and a freshly downgraded credit rating. The repricing will come. The question is whether it comes gradually (manageable) or in a step function (disruptive). GCI-Gov in the normal range tells us the acute stress is not here yet. But the inputs are all trending in the wrong direction.
How to Track This
Annual (budget cycle): Federal deficit as % of GDP from the Office of Management and Budget. The fiscal year ends September 30.
Quarterly (~75-day lag): BEA NIPA data for interest payments, receipts, expenditures. Debt-to-GDP from the Federal Reserve. These move slowly but tell you about the structural trajectory.
Monthly (~30-day lag): Monthly Treasury Statement for real-time deficit tracking. This is the highest-frequency fiscal data available.
Daily: ACM term premium from the New York Fed. 10-year yield from the Federal Reserve. These are the market’s real-time verdict on fiscal sustainability.
Per auction: Treasury auction results from TreasuryDirect. Bid-to-cover ratios, tail size, and primary dealer share. The canary in the coal mine for demand stress.
Quarterly (refunding): Treasury Quarterly Refunding Announcement. The maturity mix decision (bills vs. coupons) has direct implications for term premium and plumbing.
Invalidation Criteria
Bullish invalidation (fiscal stress dissipates):
Deficit narrows to below 4% of GDP sustainably (not just a cyclical revenue bump)
Term premium stabilizes below 50 basis points with healthy auction metrics
Bipartisan fiscal consolidation passes (mandatory spending reform)
Interest expense peaks and stabilizes as a percentage of revenue
Productivity boom raises nominal GDP growth above the weighted average interest rate
Bearish invalidation (our concern is wrong):
Foreign demand for Treasuries surges on safe-haven flows, overwhelming supply
Fed restarts QE or institutes yield curve control, artificially capping term premium
Dollar reserve currency status proves sufficient to absorb unlimited issuance without repricing
Inflation falls enough to allow aggressive rate cuts, reducing the interest expense trajectory
The Bottom Line
The government is not just setting policy. It is the largest market participant on Earth. When the borrower is this big and the buyer base is shifting from price-insensitive (the Fed, foreign central banks) to price-sensitive (domestic asset managers, hedge funds), term premium is the release valve. We think it needs to go higher. That repricing will tighten financial conditions even if the Fed cuts. It is the structural tension underlying everything else in 2026.
Pillar 8 connects forward. It feeds directly into Pillar 9 (Financial Conditions, because fiscal stress widens credit spreads) and Pillar 10 (Plumbing, because Treasury issuance is the primary drain on system liquidity). The Monetary Mechanics engine is where these three pillars reinforce each other: the government borrows, plumbing strains, financial conditions tighten. That is the loop. Understanding it is not optional for navigating what comes next.
This is how we analyze government fiscal dynamics.
This is the 8th in a 12-part series on the Lighthouse Macro framework.
Next up: Financial Conditions and the Credit Cycle.
Bob Sheehan, CFA, CMT
Founder & CIO, Lighthouse Macro