

Housing: The Collateral Engine
The Diagnostic Dozen: A Framework for Reading the Macro Cycle (5 of 12)

Previously in this series: Labor | Prices | Growth | Consumer
Housing is not shelter. It is the financial system’s collateral backbone, the Fed’s primary transmission channel, and the single most rate-sensitive sector in the economy. Miss it, and you’re trading the economy of 2024 while living in 2026.
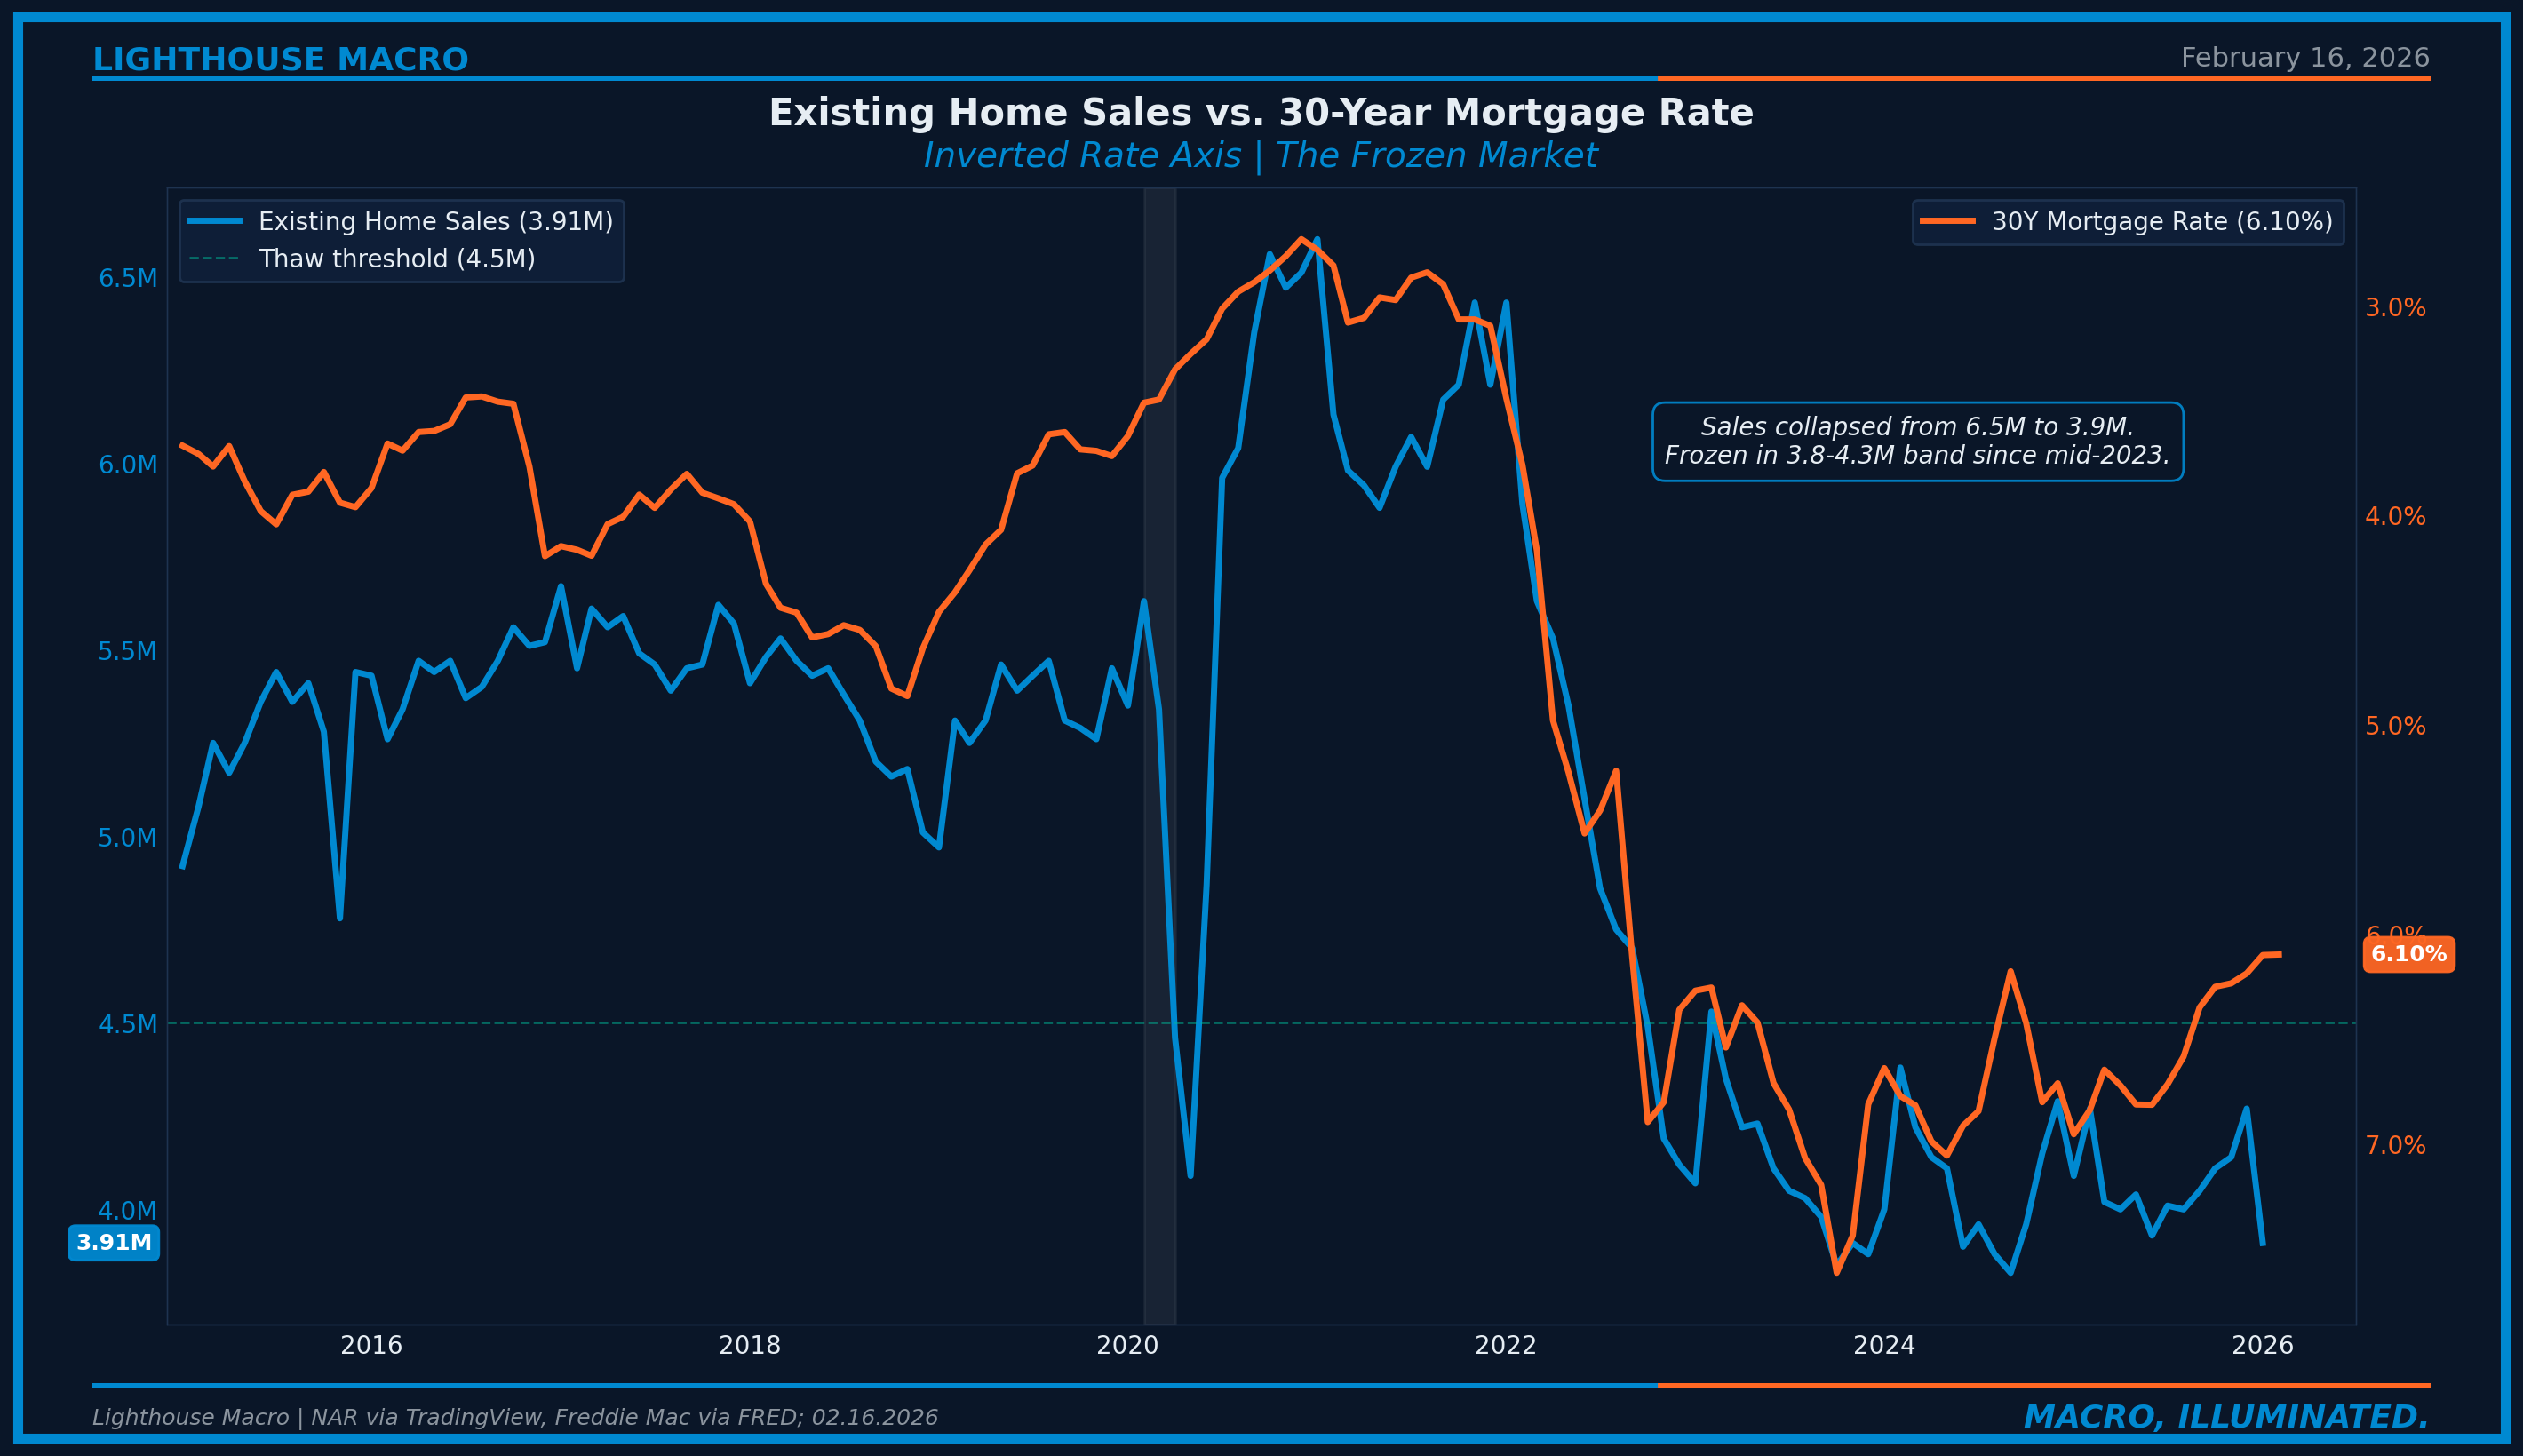
The paradox of the current housing market is straightforward: prices are stable, transactions are frozen, and everyone is waiting for someone else to move first. Existing home sales just printed 3.91 million (SAAR) in January 2026, the lowest since September 2024 and still 40% below the 2021 peak. Median prices rose 0.9% year-over-year. The market is not crashing. It is not recovering. It is stuck.
Most analysis stops at rates and prices. Mortgage rates are down, prices are up, so the market must be fine. Or: rates are still too high, so the market must be broken. Both framings are incomplete. They miss the structural dynamics that determine when this frozen equilibrium breaks, which direction it breaks, and what it means for everything else in the macro cycle.
The question is not whether housing is expensive. It is whether the lock-in effect, the structural deficit, and the affordability math are converging toward a thaw or a deeper freeze. Answering that requires a framework, not a headline.
The Core Insight: The Frozen Equilibrium
Housing markets can be frozen without being broken. Transaction volumes collapse while prices hold because buyers and sellers retreat simultaneously for different reasons. Buyers can’t afford current rates. Sellers refuse to list because they’re locked into 3-4% mortgages and the math of moving to a 6% mortgage is punishing. The result is stasis. Not a correction. Not a recovery. A standoff.
This is not 2008. That was a credit crisis where overleveraged borrowers defaulted, inventory flooded the market, and prices collapsed 35% nationally. The current cycle is a rate shock freeze. Rates doubled from 3% to 7% in 18 months, the fastest tightening of housing finance since the Volcker era. But unlike 2008, the borrower profile is strong. Median FICO on new originations exceeds 750. Negative equity is 2.1%. Delinquencies are near historic lows.
We call this the “golden handcuffs.” Over 80% of outstanding mortgages carry rates below the current market rate by 200+ basis points. The MBA estimates that this lock-in effect has removed roughly 1.5 million potential listings from the market, creating a self-reinforcing loop:
Low listings → low inventory → price support → high prices worsen affordability → fewer buyers → fewer transactions → sellers see no urgency → fewer listings.
The equilibrium is fragile. It breaks one of two ways: rates decline enough to unlock supply and demand simultaneously (every 50 basis points frees a new cohort of locked-in sellers), or an external shock forces selling into a market with insufficient demand. Which break comes first is the entire housing call.
The Three-Stage Housing Stress Sequence provides the operational framework:
Stage 1: Rate Shock (2022-2023). Rates spike. Transactions collapse. Prices wobble but hold because inventory evaporates alongside demand. This is where the lock-in effect kicks in.
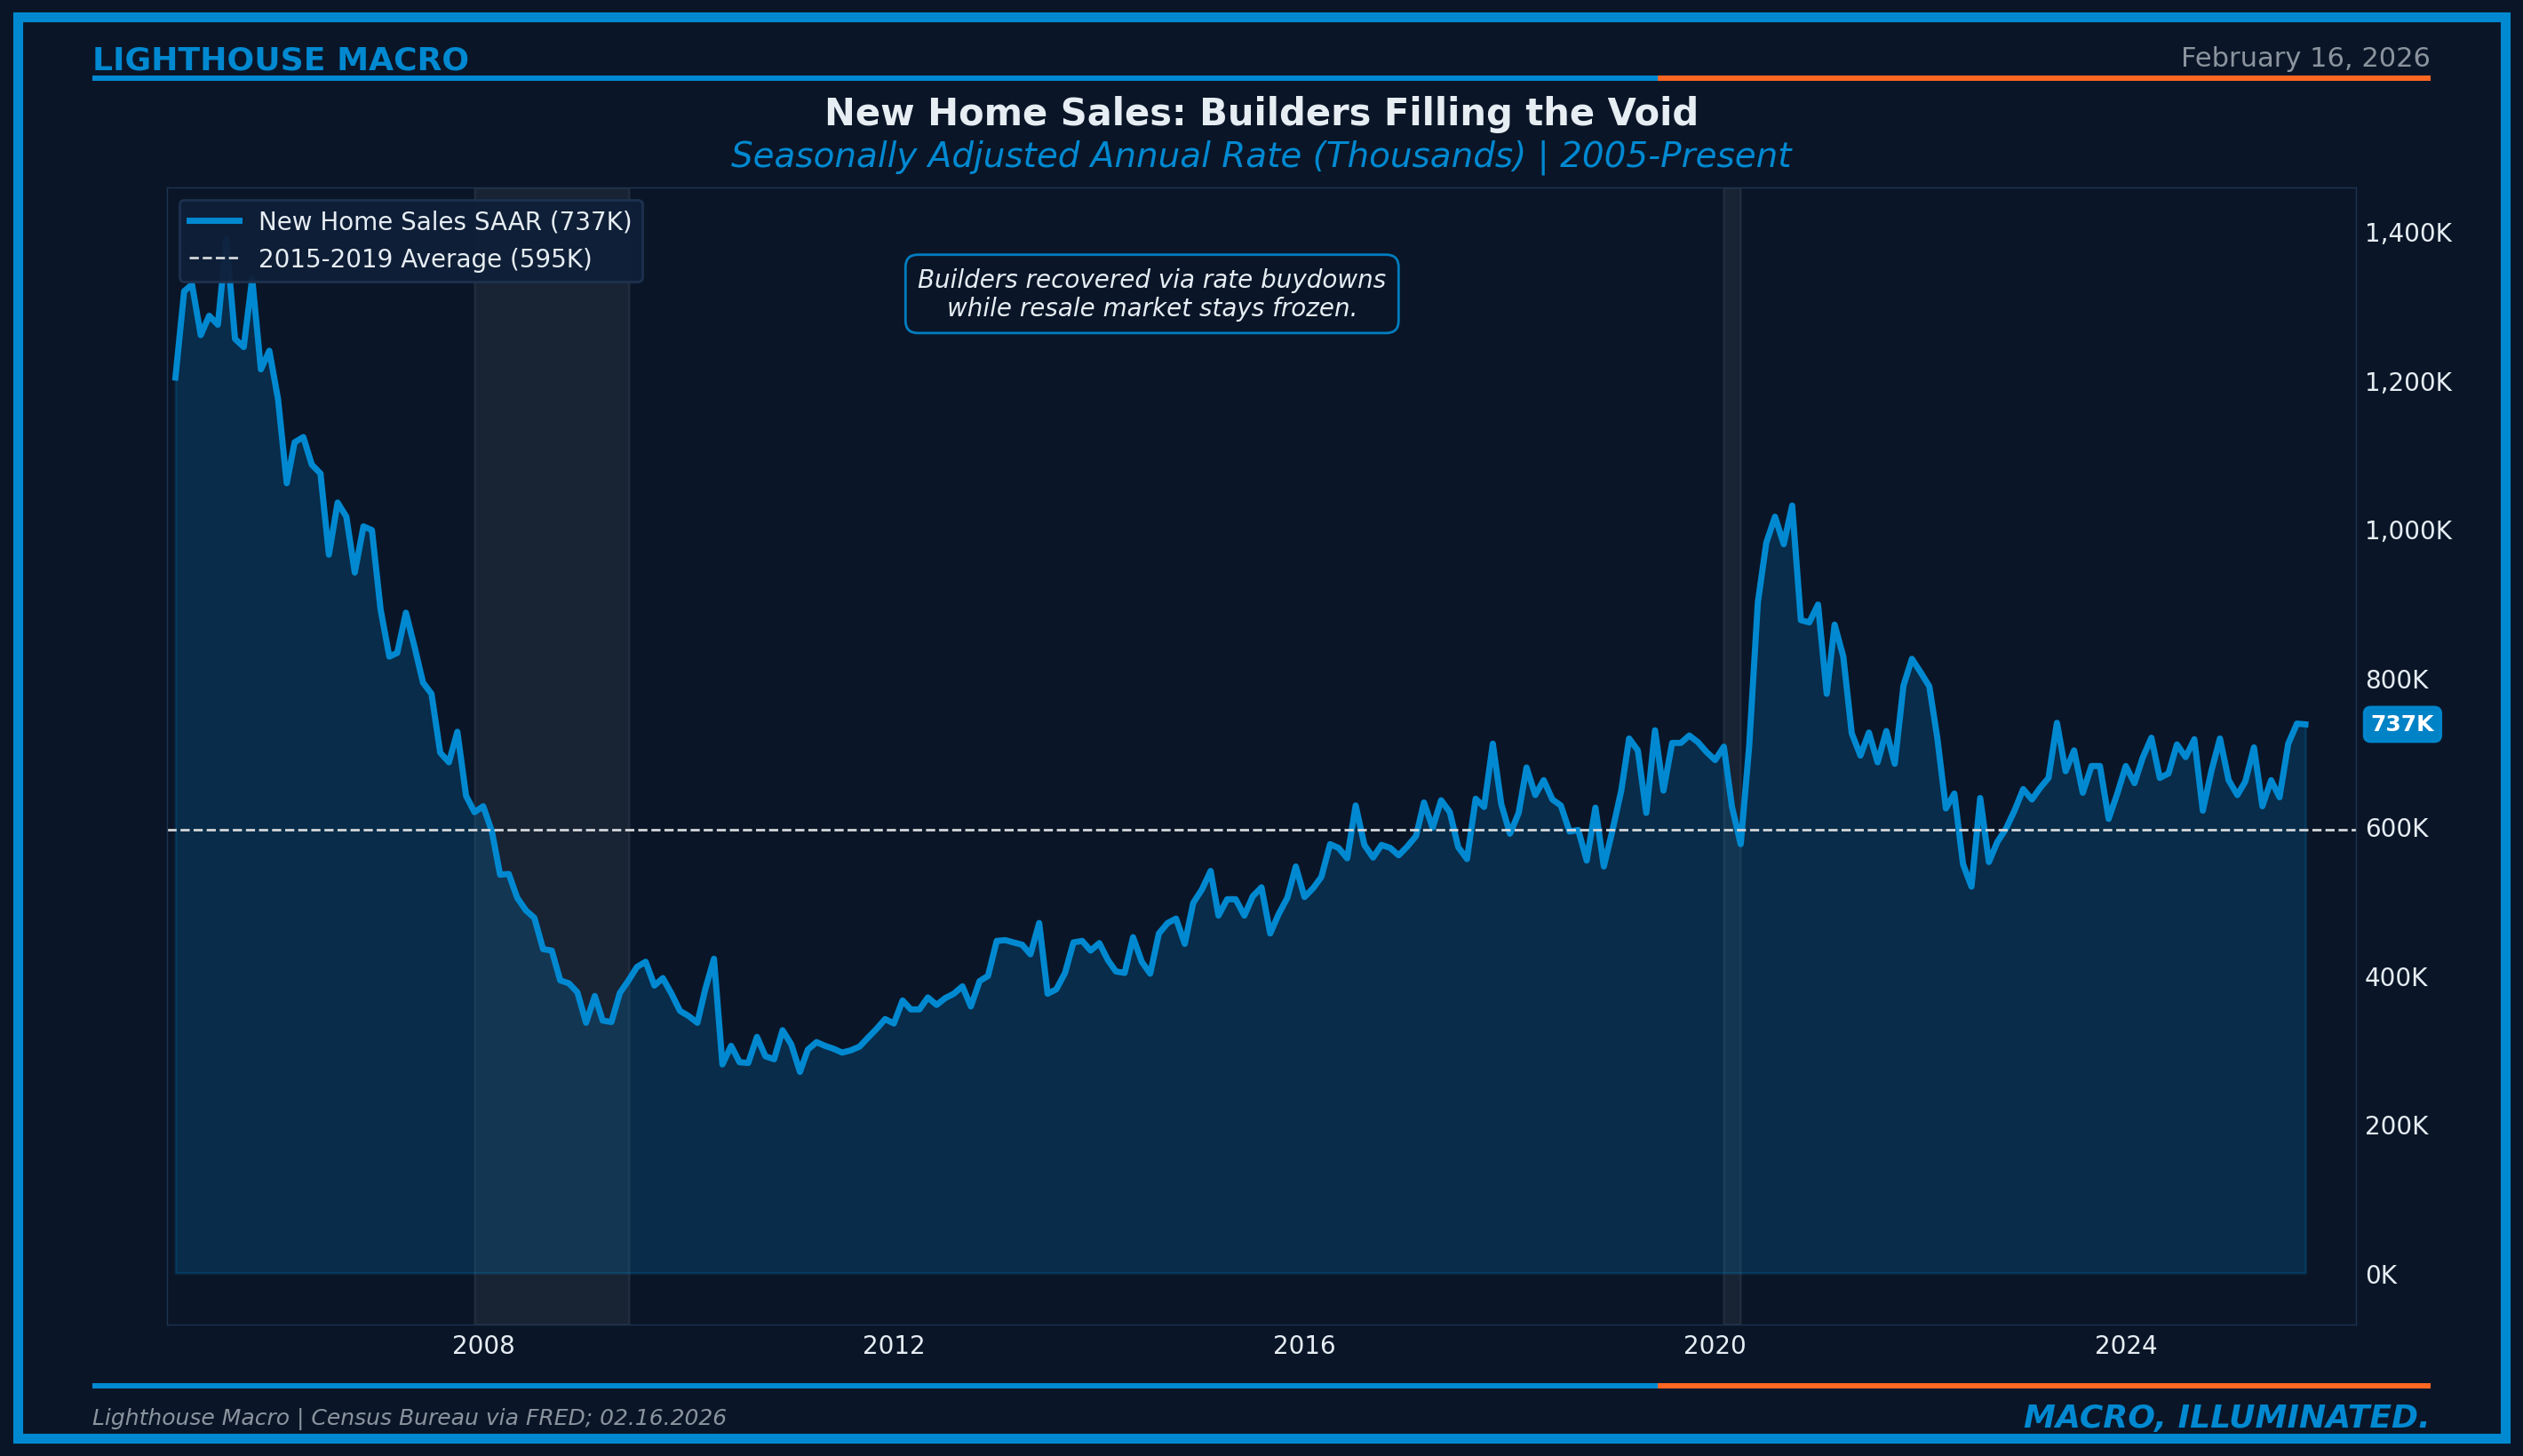
Stage 2: Frozen Equilibrium (2023-Present). Low transactions, low inventory, stable-to-rising prices. Builders capture market share from locked-in resale sellers. New home sales as a percentage of total sales reaches historically elevated levels. The market is stable, not healthy.
Stage 3: Resolution. Either rates ease enough to unlock supply and demand simultaneously (bullish resolution), or an economic shock forces sellers into a market that lacks sufficient demand to absorb them (bearish resolution).
We are deep in Stage 2. The critical question is which version of Stage 3 we’re heading toward, and the indicators that follow are how we answer it.
What to Watch and Why
Housing analysis requires three lenses: demand (who wants to buy and whether they can), supply (what’s available and what’s coming), and credit health (whether stress can transmit to the financial system). Watching only one guarantees you miss the turn. The discipline is triangulating across all three.
The Indicators That Matter
Existing Home Sales: The Volume Signal
Existing home sales capture roughly 85% of all transactions. The January 2026 print of 3.91 million (SAAR) was the sharpest monthly decline in nearly four years, down 8.4% from December. The long-term median is 5.23 million. Current levels are 25% below that, oscillating in a 3.8-4.4 million band since mid-2023. A sustained move above 4.5 million signals thawing. Below 3.5 million signals the freeze is deepening.
New Home Sales and the Builder Market Share
While existing sales froze, builders told a different story. New home sales at 737,000 SAAR are capturing outsized share because builders can offer what locked-in resale sellers cannot: rate buydowns, incentives, and move-in-ready inventory. New homes now represent roughly 16% of total sales versus a historical norm closer to 10-12%. That shift is structural, not cyclical. As long as the lock-in effect suppresses resale listings, builders fill the gap. The 2015-2019 average was 595,000. Current levels are 24% above that, even with rates north of 6%.
The Shelter Inflation Bridge: Market Rents to CPI
Shelter represents 34% of CPI and 18% of Core PCE. Market rents lead official CPI shelter by 12-18 months with remarkable reliability. This is the single most important cross-pillar indicator in the housing framework.
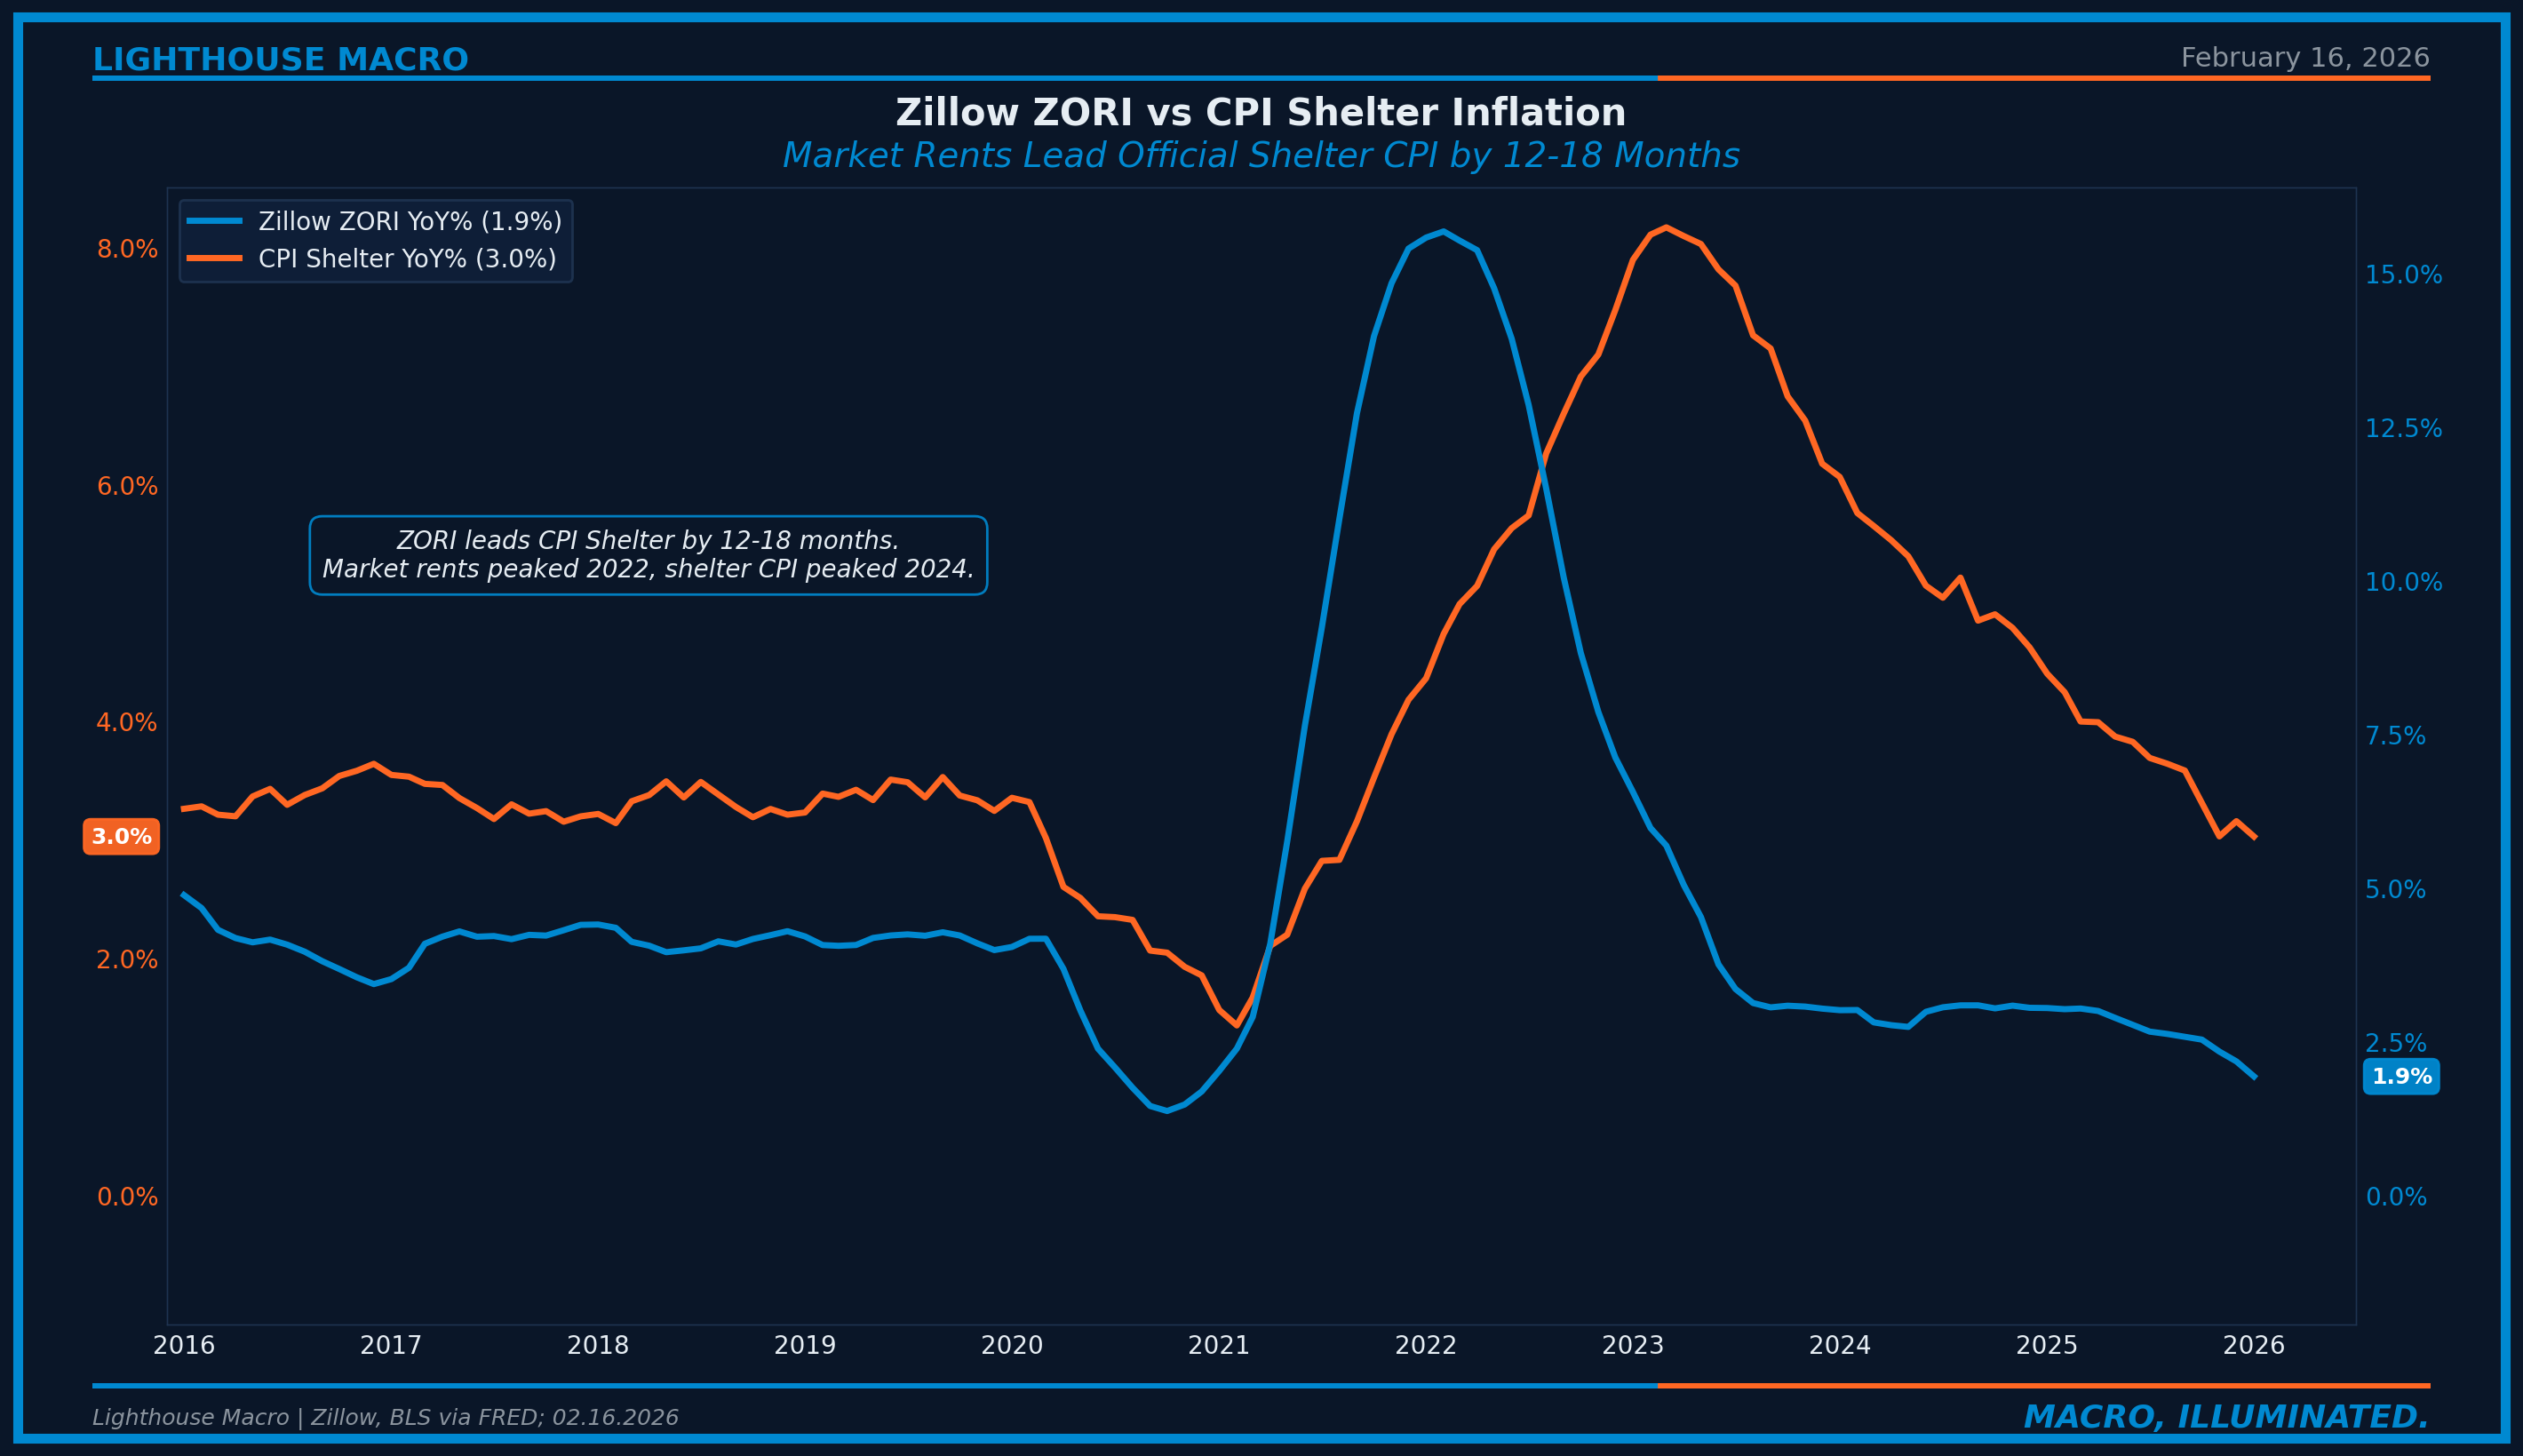
National rents per Zillow are running roughly 1.9% year-over-year. CPI shelter has decelerated to 3.0% as of January 2026, consistent with the ZORI signal from 12-18 months prior. With market rents under 2%, further shelter deceleration toward 2.5% by late 2026 is the base case, mechanically dragging core CPI lower by 0.2-0.4 percentage points. This feeds directly into Fed policy, mortgage rates, and the housing market itself. A feedback loop with a long delay.
Mortgage Rates and Affordability: The Binding Constraint
The 30-year fixed mortgage rate averaged 6.09% for the week ending February 12, 2026, down from 6.87% a year ago. Rates have been in a 6.0-6.3% range since December 2025, the lowest sustained level since September 2022.
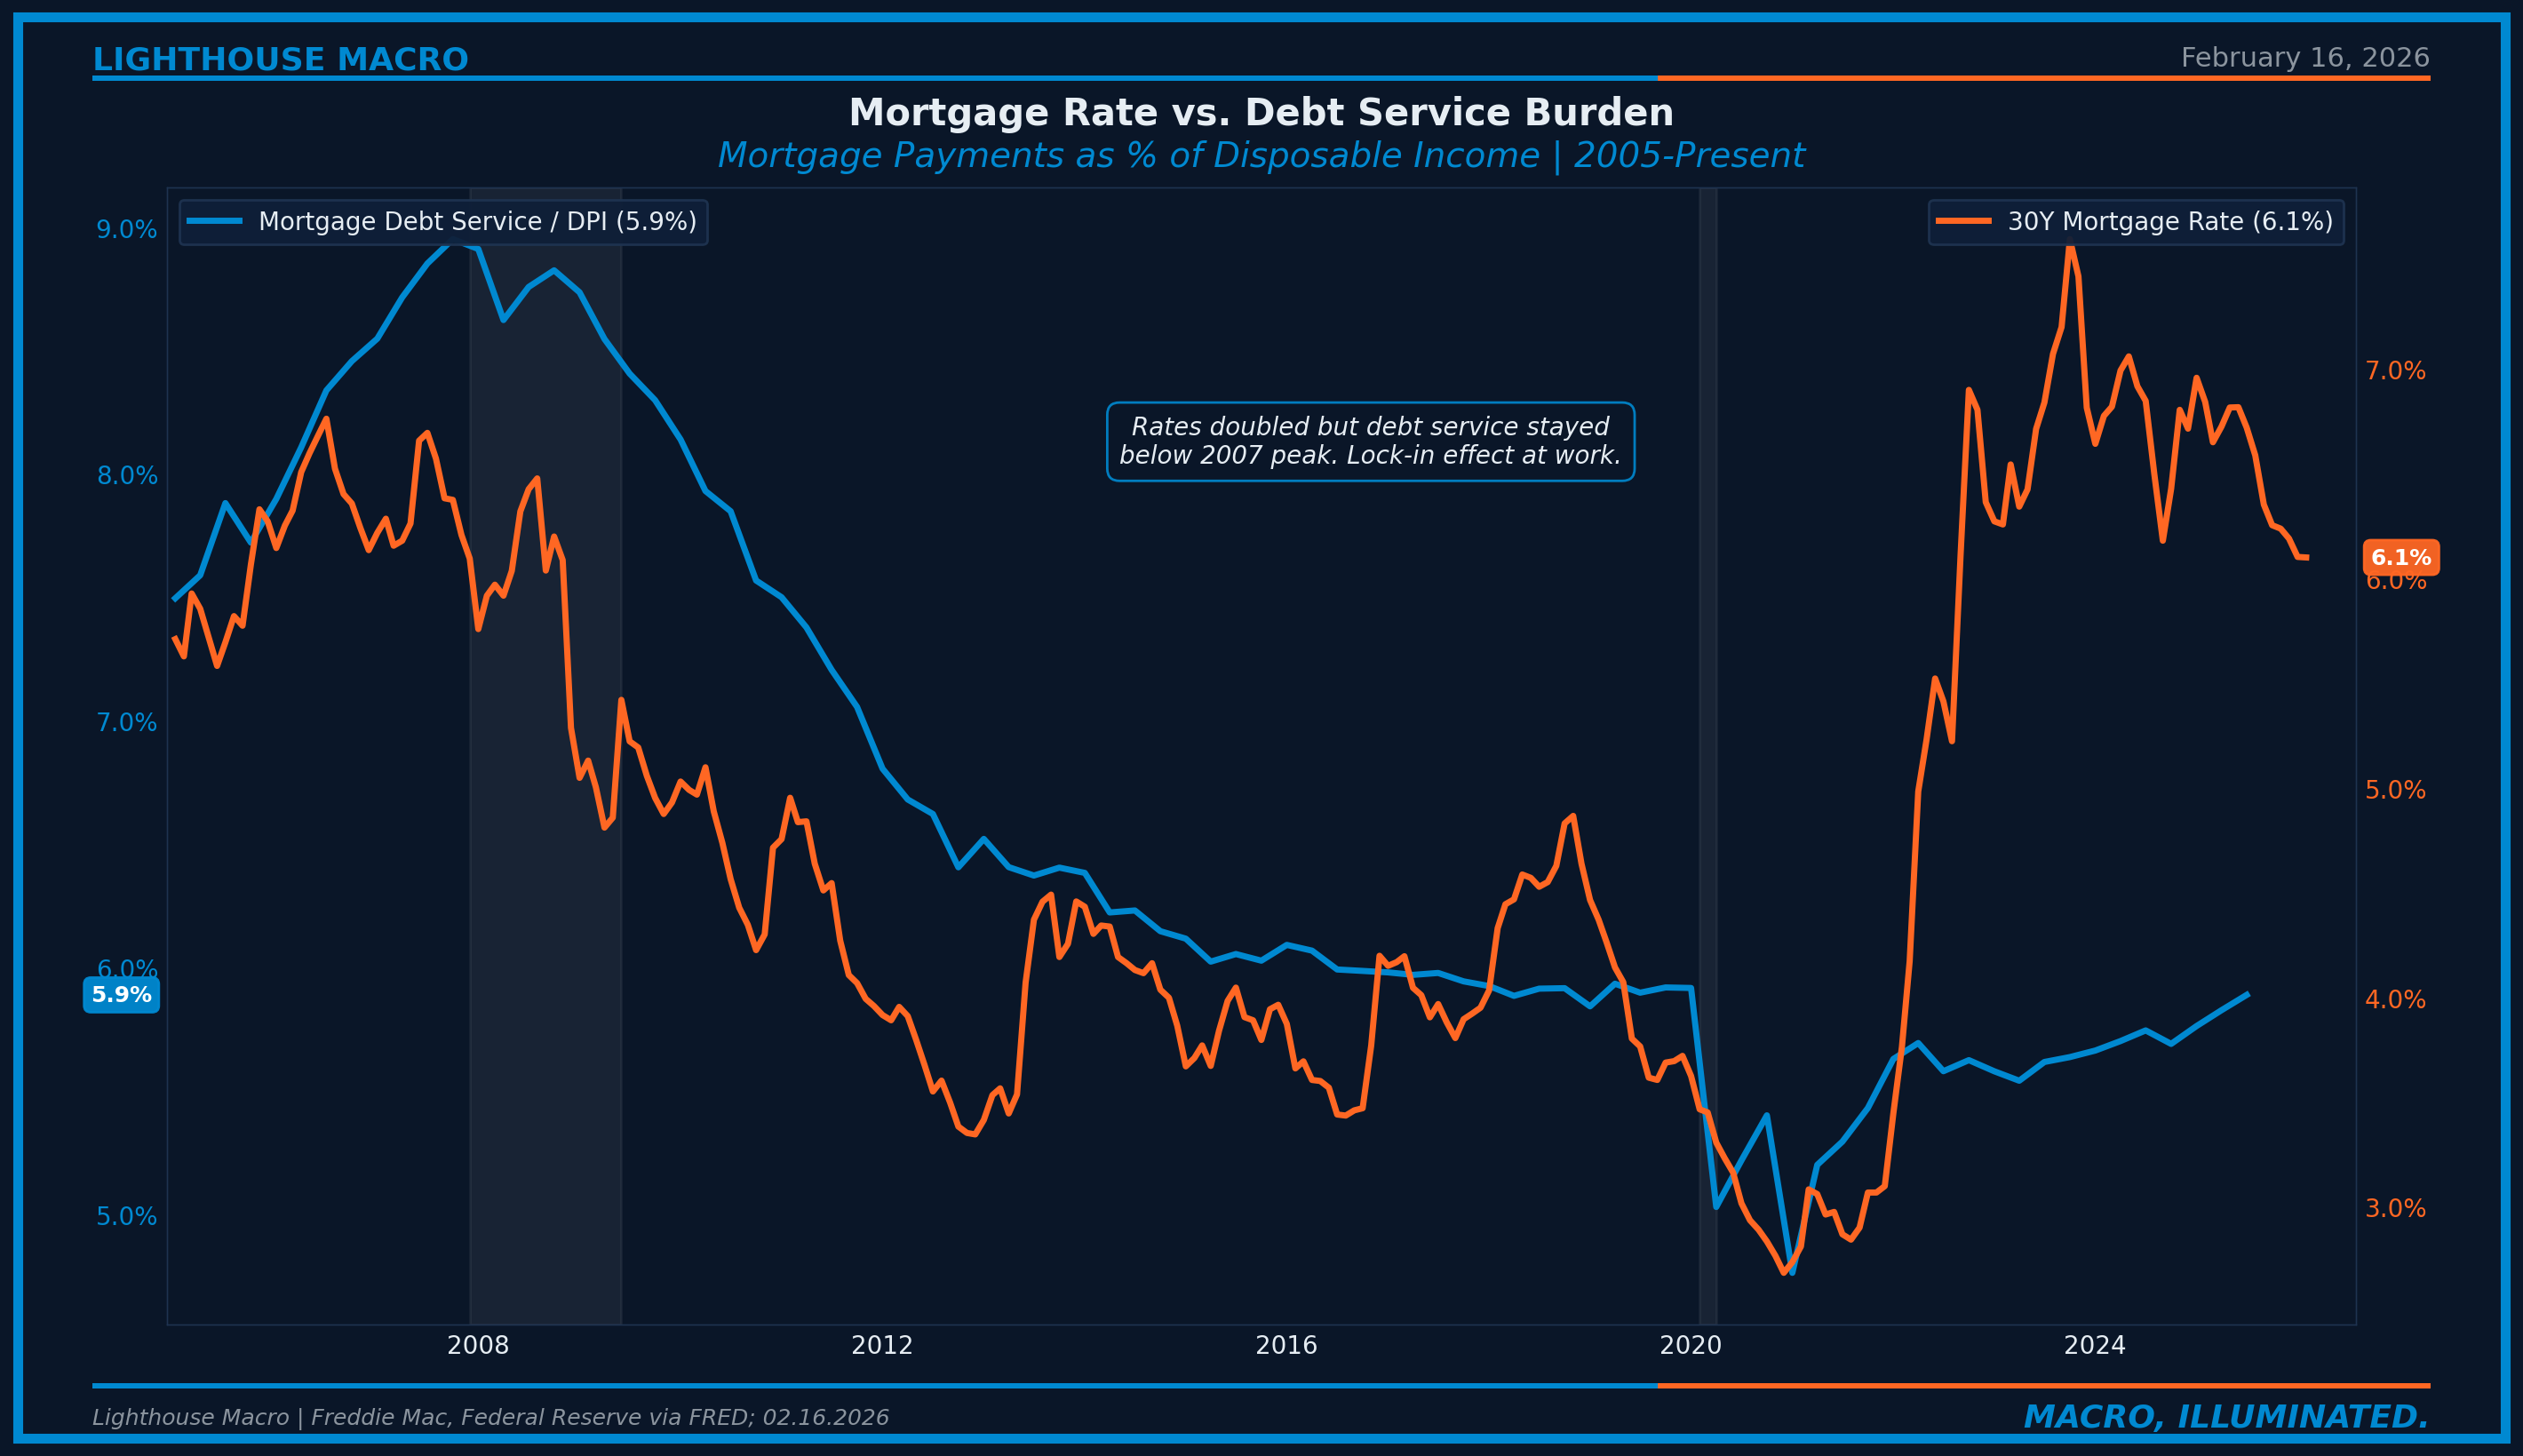
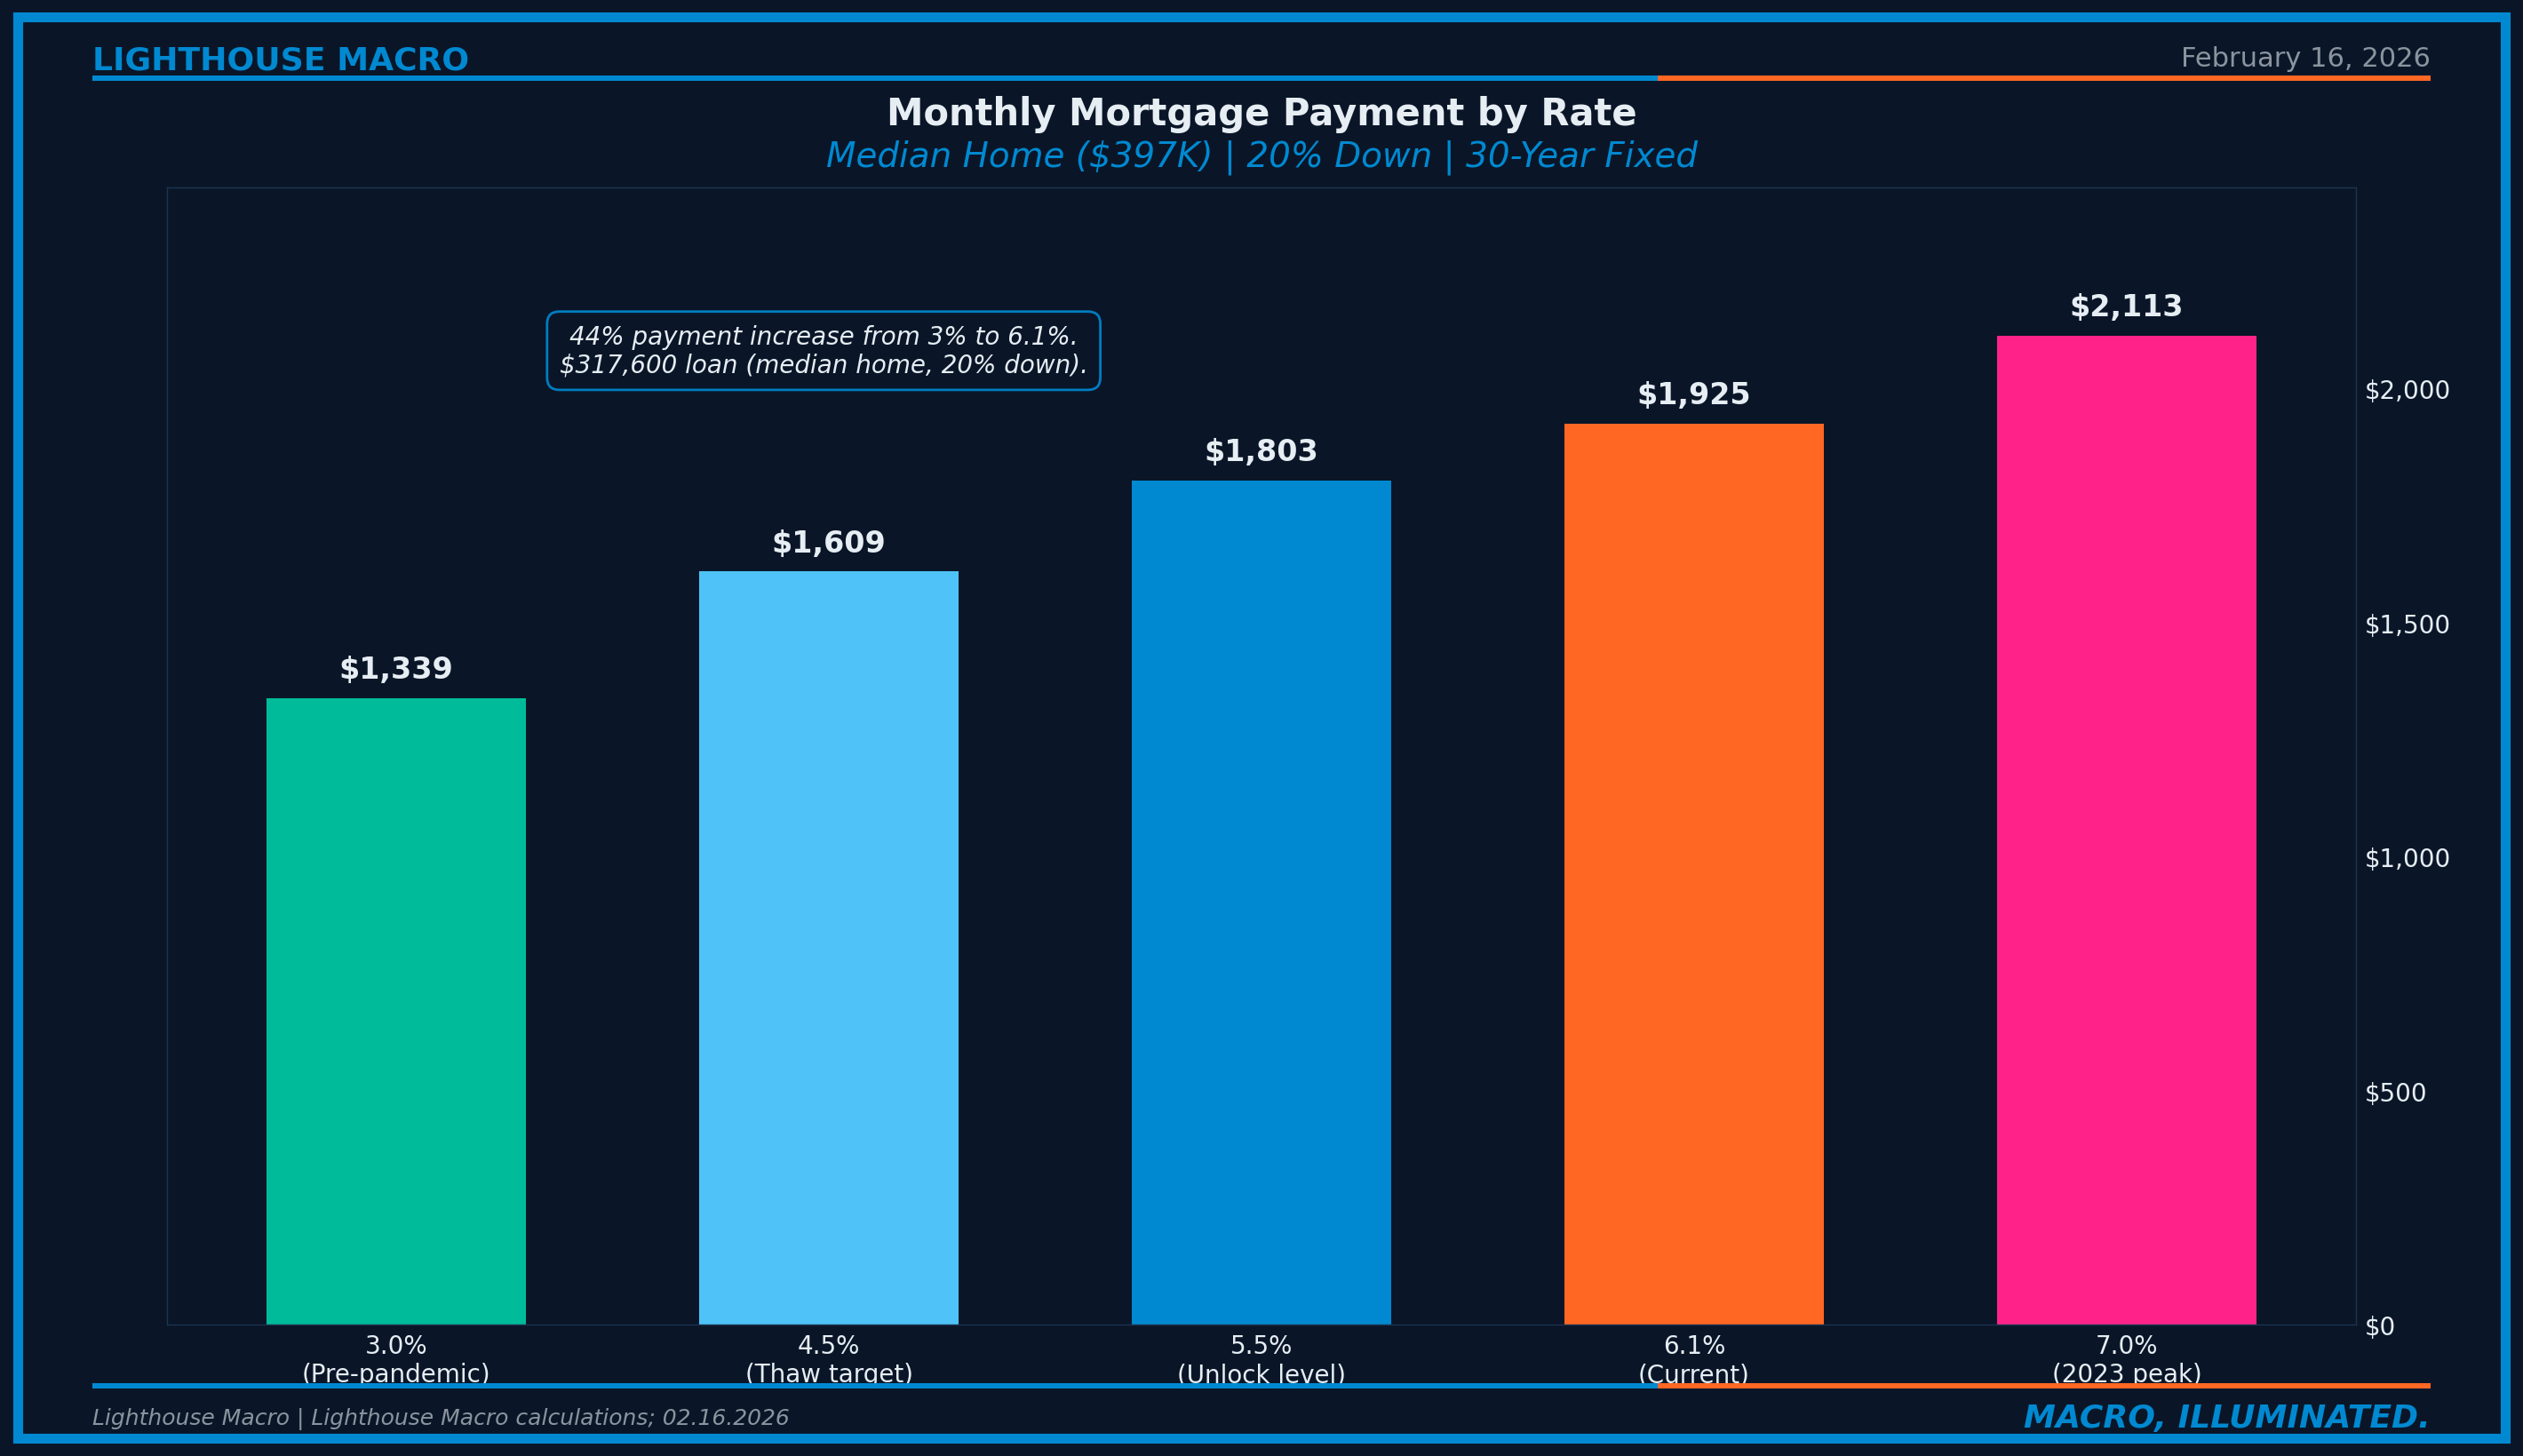
The affordability math is unforgiving. At 6.1%, the monthly payment on a median-priced home ($396,800, 20% down) is approximately $1,925 versus $1,340 at pre-pandemic 3.0% rates. That 44% increase is why first-time buyers now account for only 31% of sales versus the historical 40%. Rule of thumb: every 100 basis points translates to roughly 10% change in affordability. The market needs rates closer to 5.5% to see meaningful unfreezing.
Builder Sentiment: The Smart Money’s Thermometer
The NAHB Housing Market Index dropped to 37 in January 2026, the 21st consecutive month below 50. Buyer traffic collapsed to 23. Builders commit capital 12-18 months ahead of sales, making them the smart money in housing.
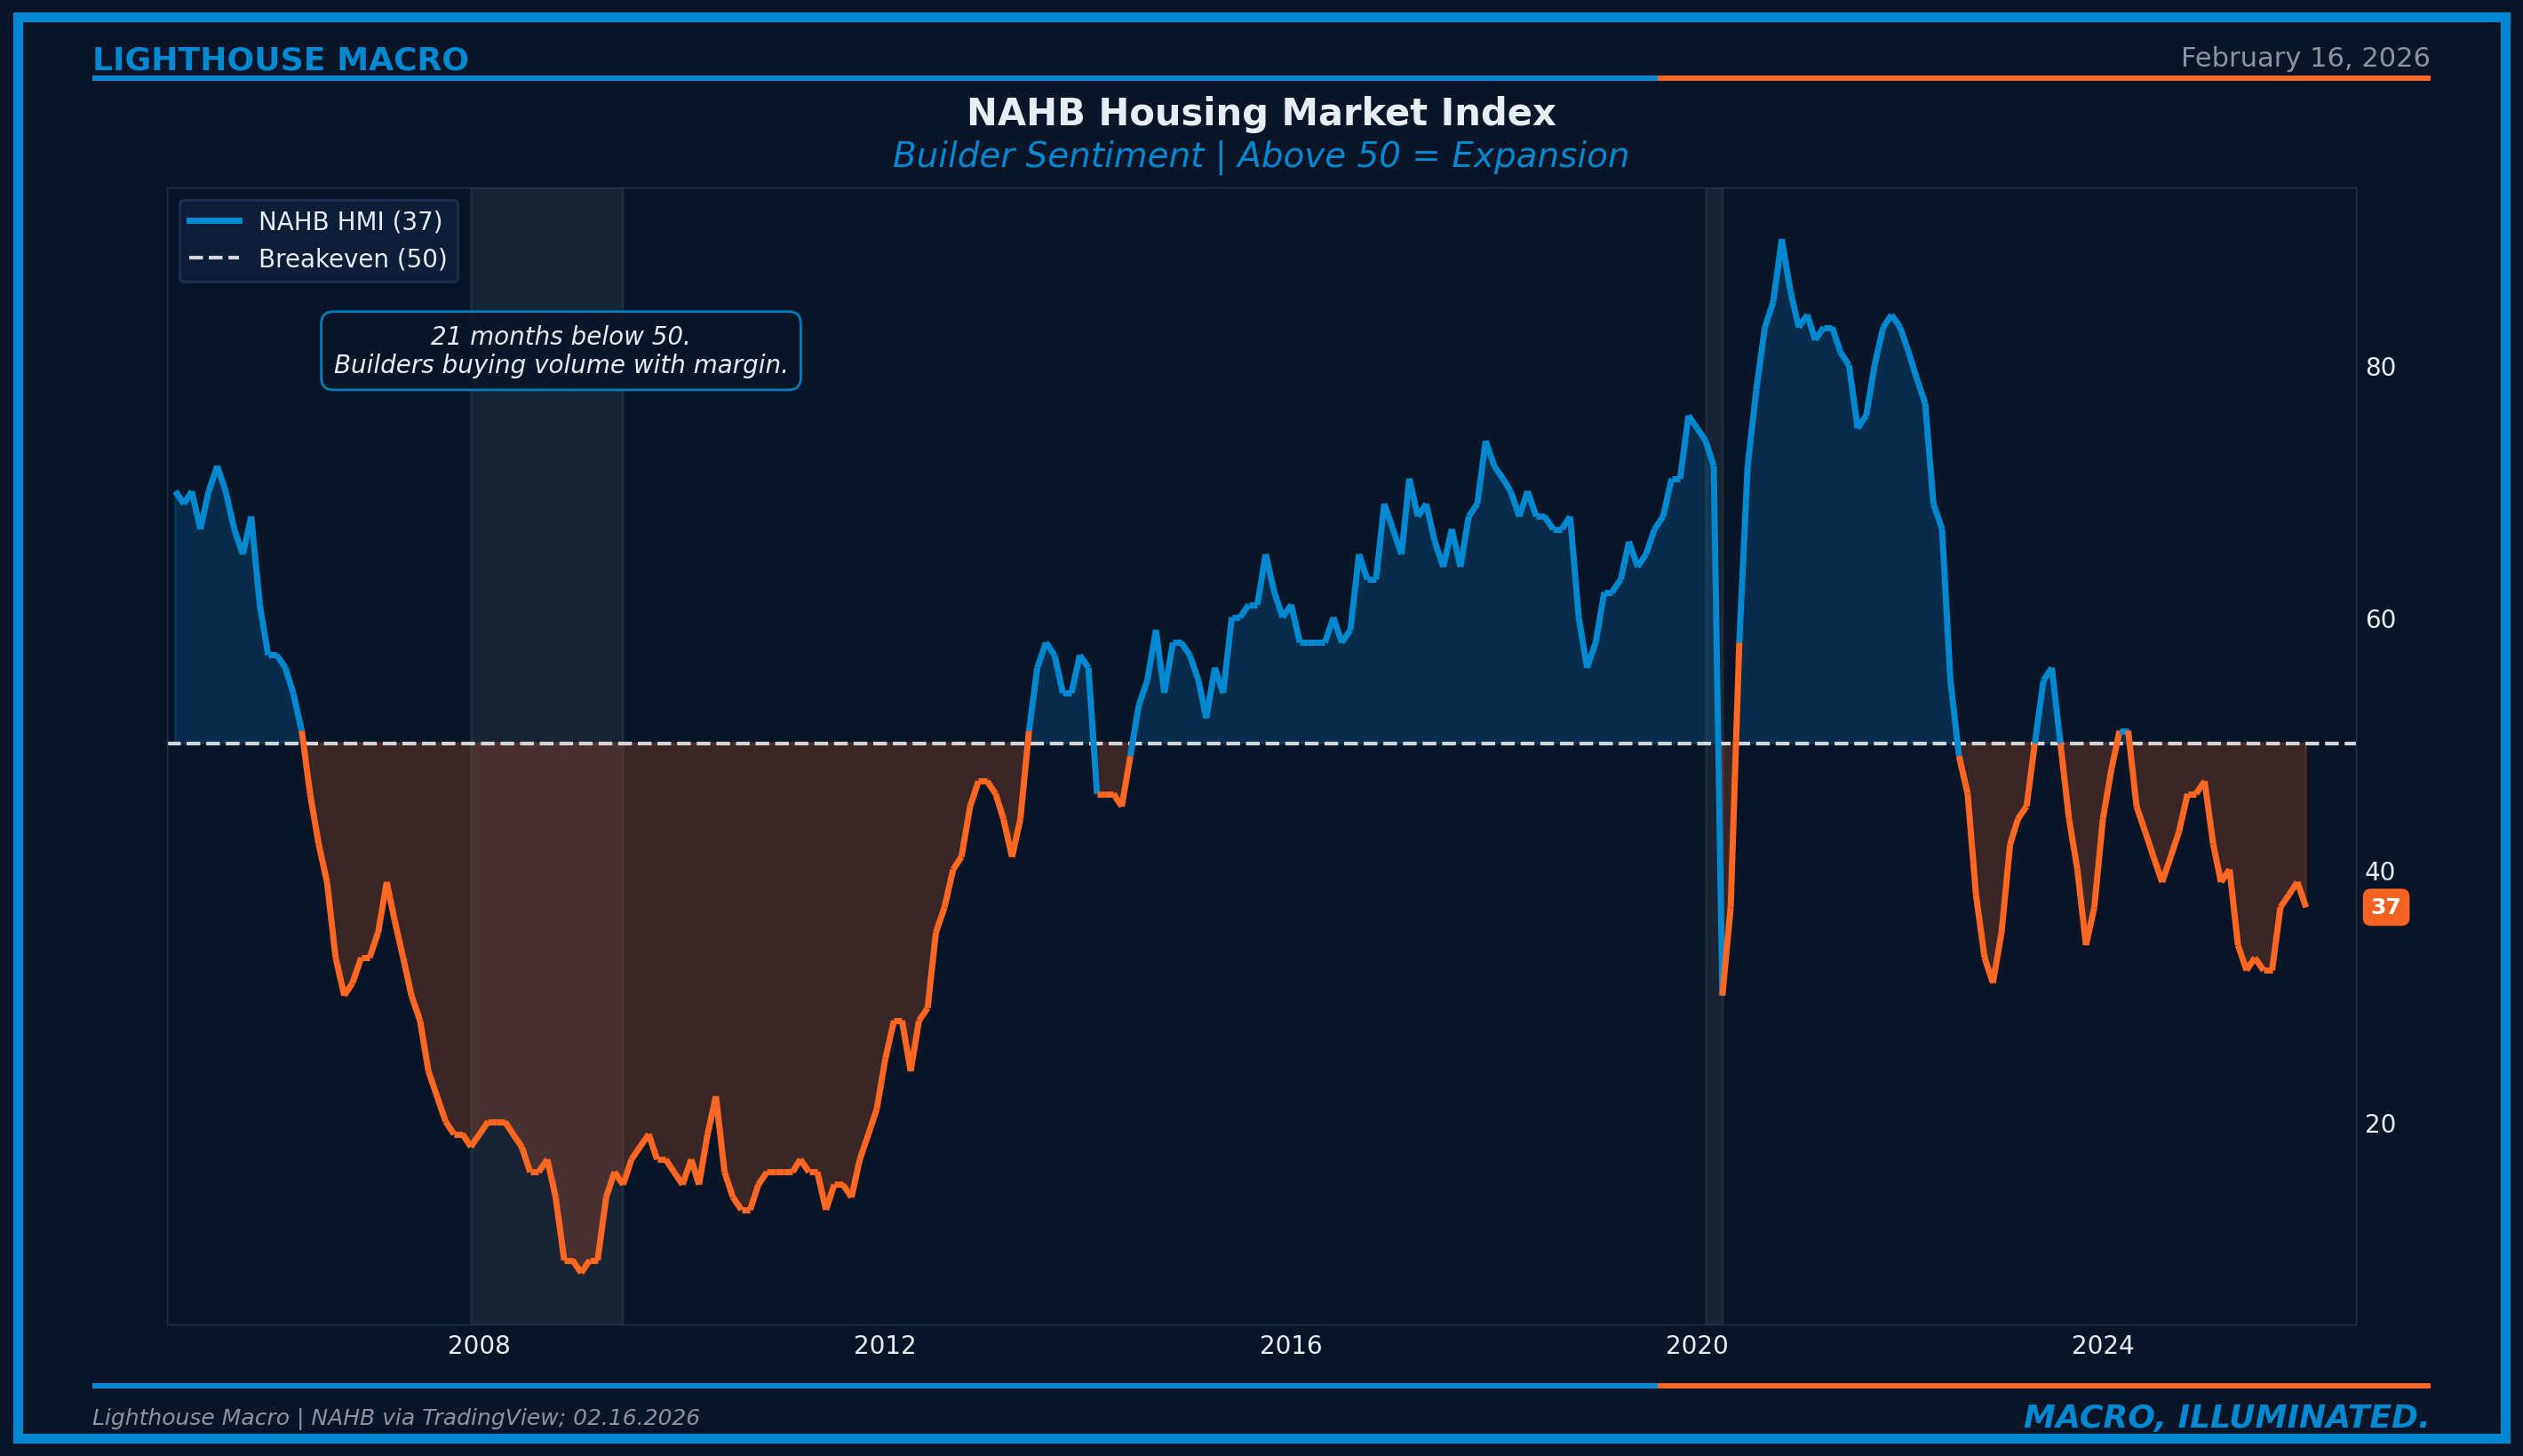
Currently, 40% of builders report cutting prices (the highest since May 2020) and 65% are offering incentives: rate buydowns, closing cost assistance, upgrades. Builders are buying volume with margin compression. Sustainable for large publics like D.R. Horton and Lennar. Less so for smaller builders, accelerating industry consolidation.
Housing Starts and Permits: The Construction Pipeline
Housing starts tumbled to 1.246 million SAAR in October 2025, the lowest since June 2020. Single-family starts were 874,000 while multi-family starts collapsed to 372,000.
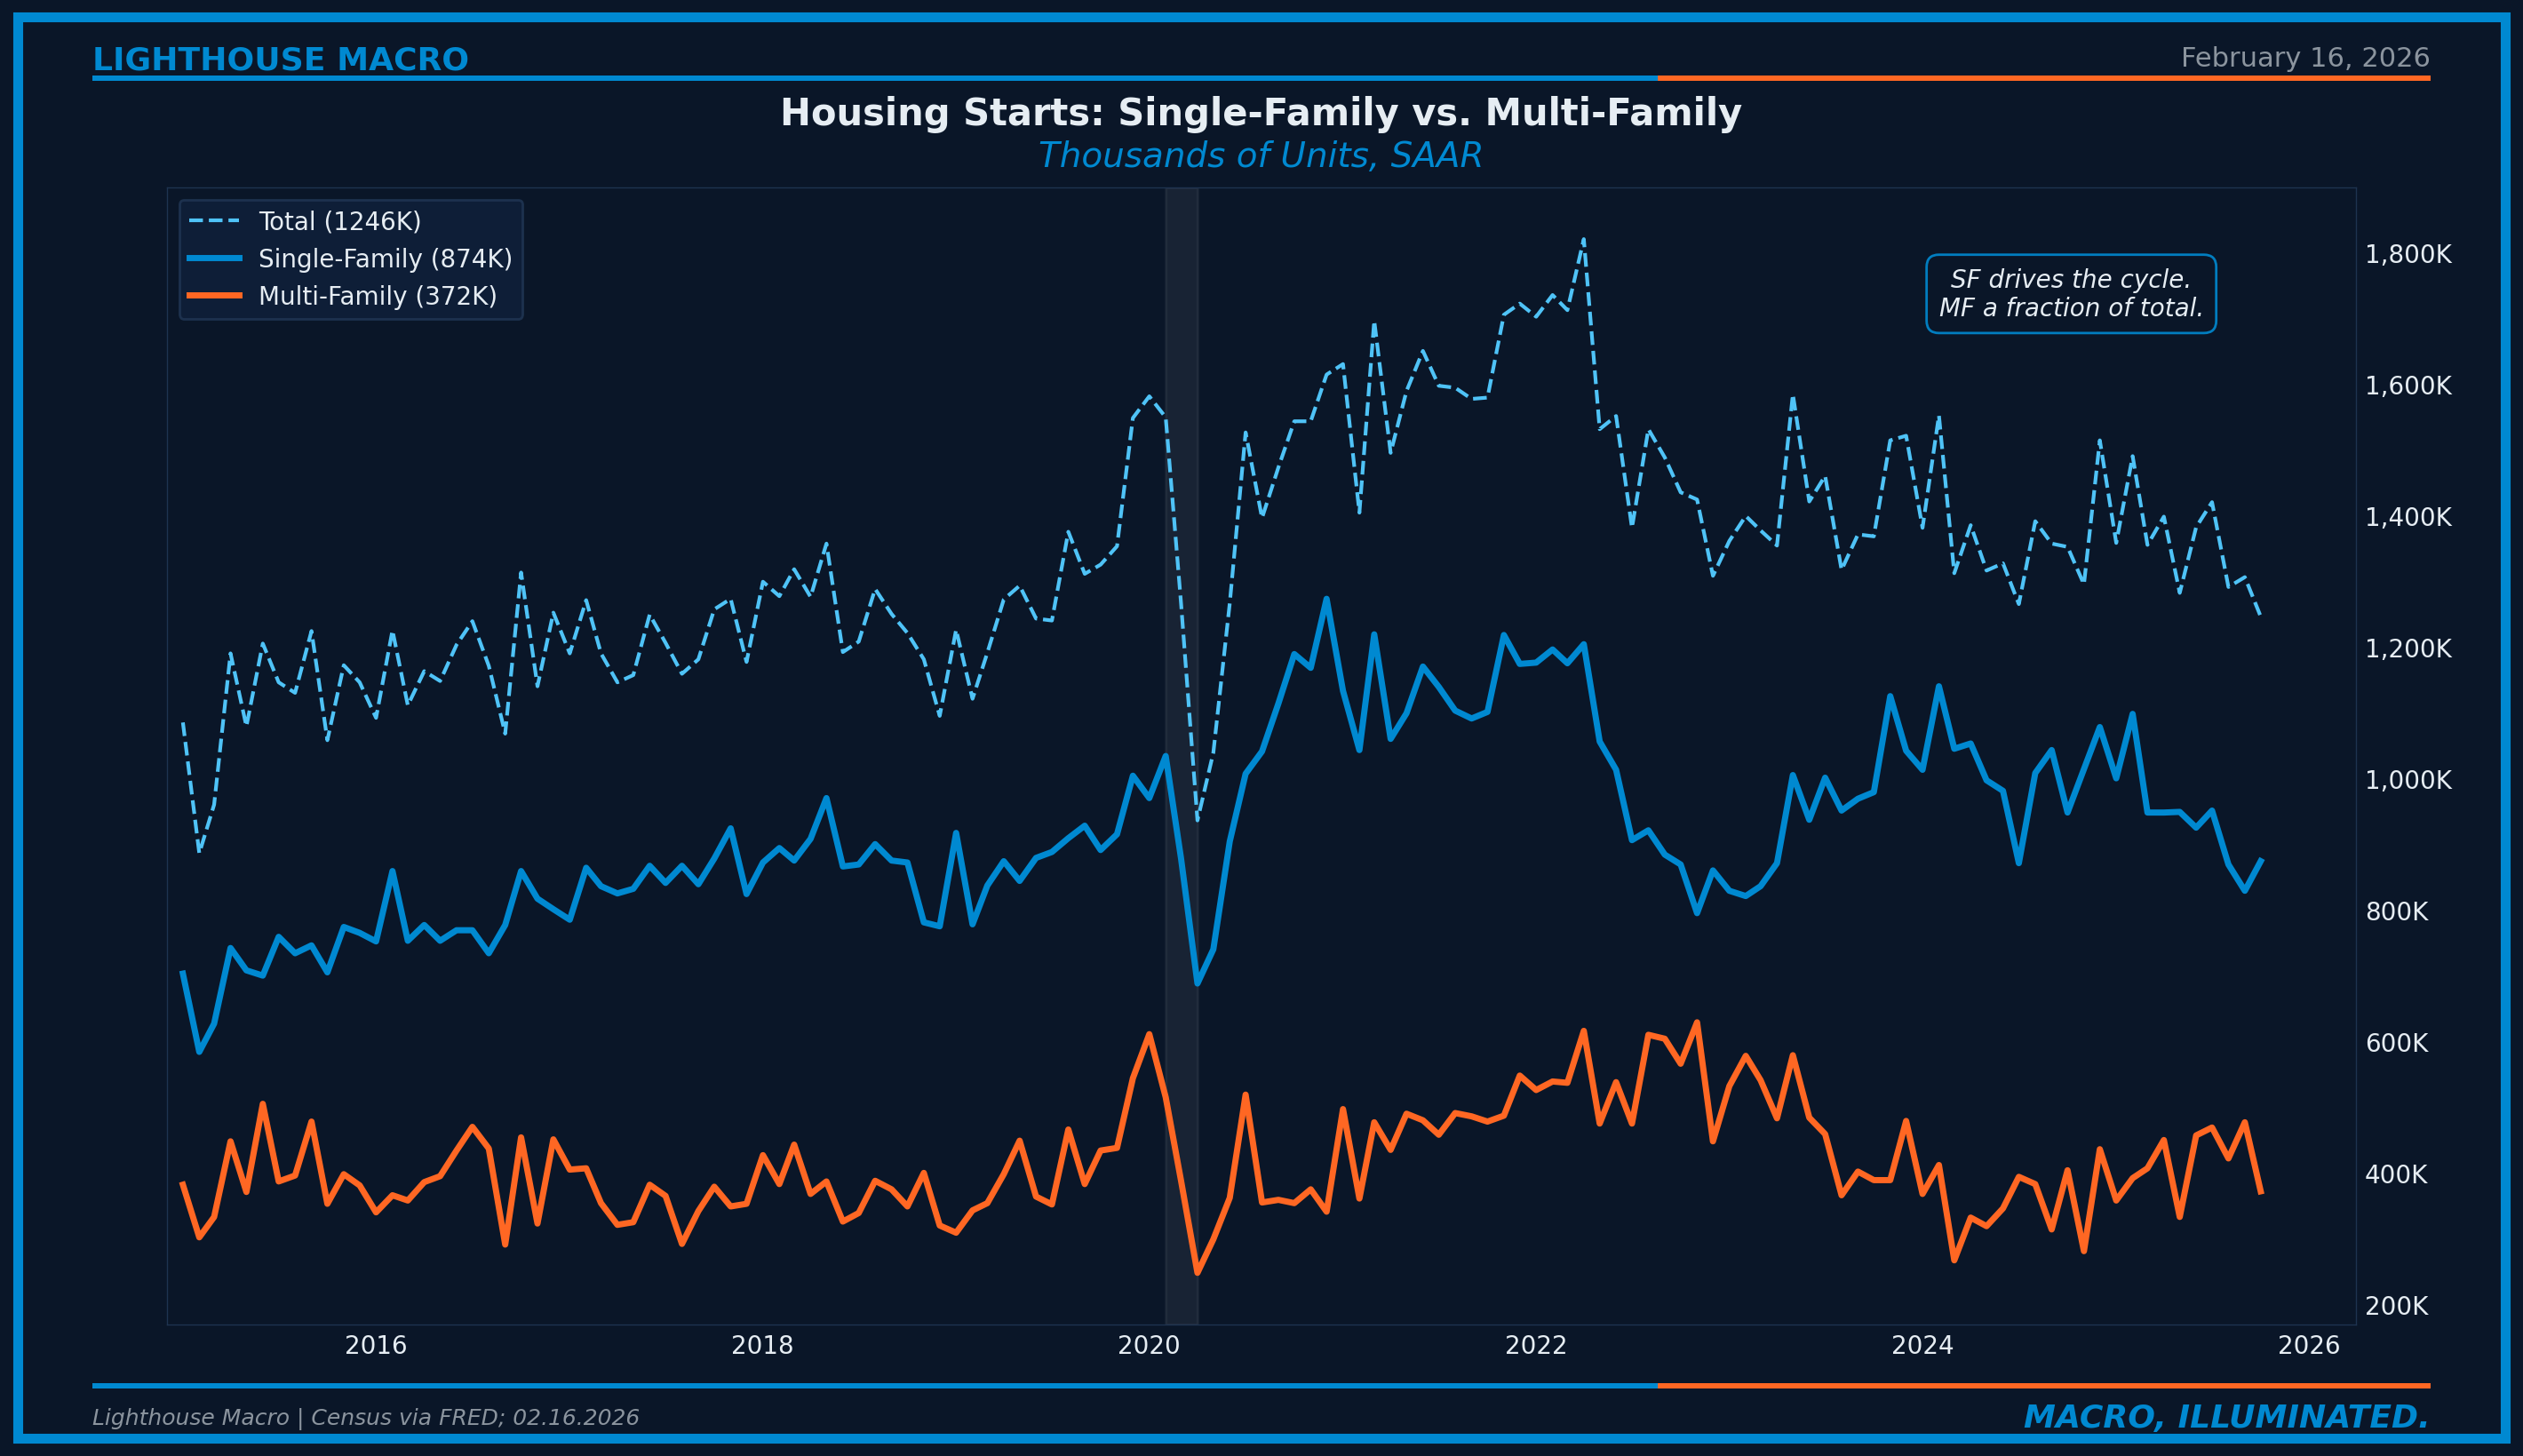
Building permits at 1.412 million lead starts by 1-2 months. The permit-start gap is a forward indicator: when permits exceed starts, the pipeline is building. When starts exceed permits, the pipeline is draining. Single-family permits at 878K remain below the roughly 1 million pace needed to match household formation.
Inventory and Supply: The Bifurcation
The inventory picture depends entirely on which market you’re looking at. Existing home inventory at 1.22 million units (3.7 months of supply) remains tight. The lock-in effect keeps resale supply structurally constrained. New home inventory tells a different story.
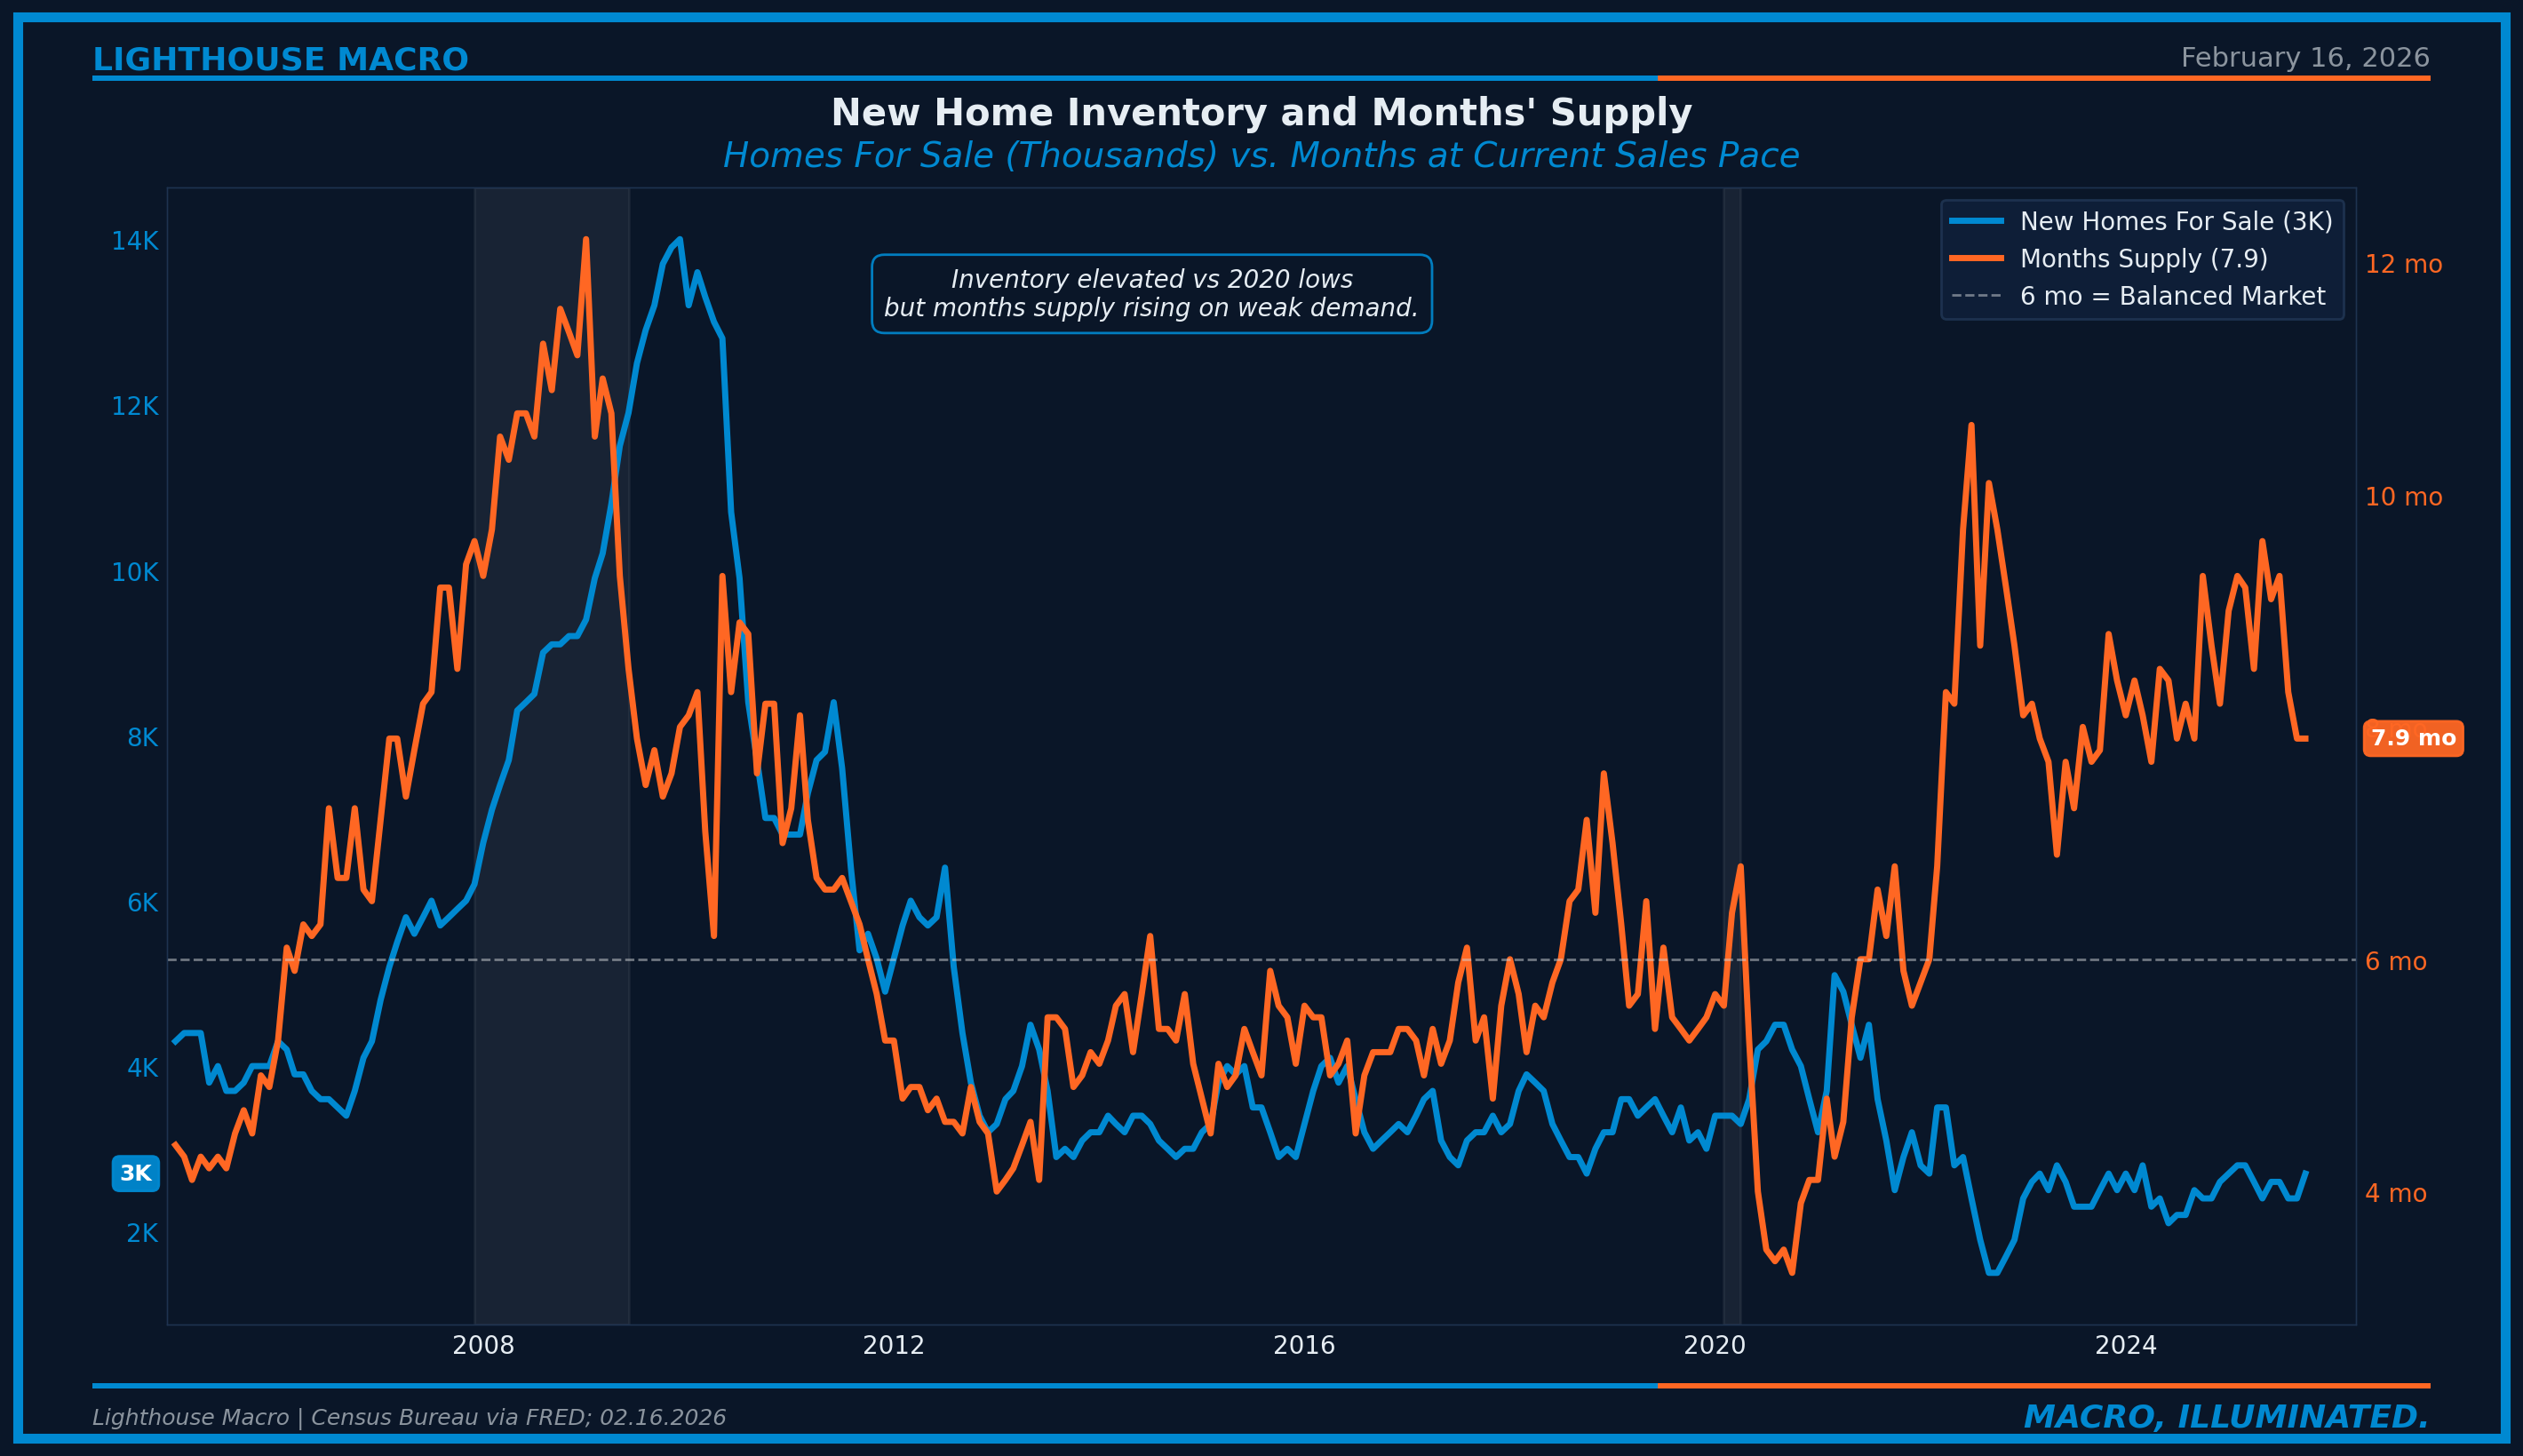
New home months' supply at 7.9 reflects builders who kept building through the rate shock and are now facing weaker demand. This is the opposite of the existing market: too much supply, not too little. Builders respond by cutting prices and offering incentives, compressing margins to sustain volume. The bifurcation, undersupplied existing market and oversupplied new market, is the defining feature of this cycle.
Freddie Mac estimates the national housing shortfall at 3-4 million units. That structural deficit is the floor under prices broadly. But new home inventory at current levels means builders, not existing homeowners, will bear the brunt of any further demand weakness.
Home Prices: The Lagging Confirmation
Home prices are the most watched and least useful leading indicator in housing. They lag transaction activity by 3-6 months and are distorted by compositional shifts.
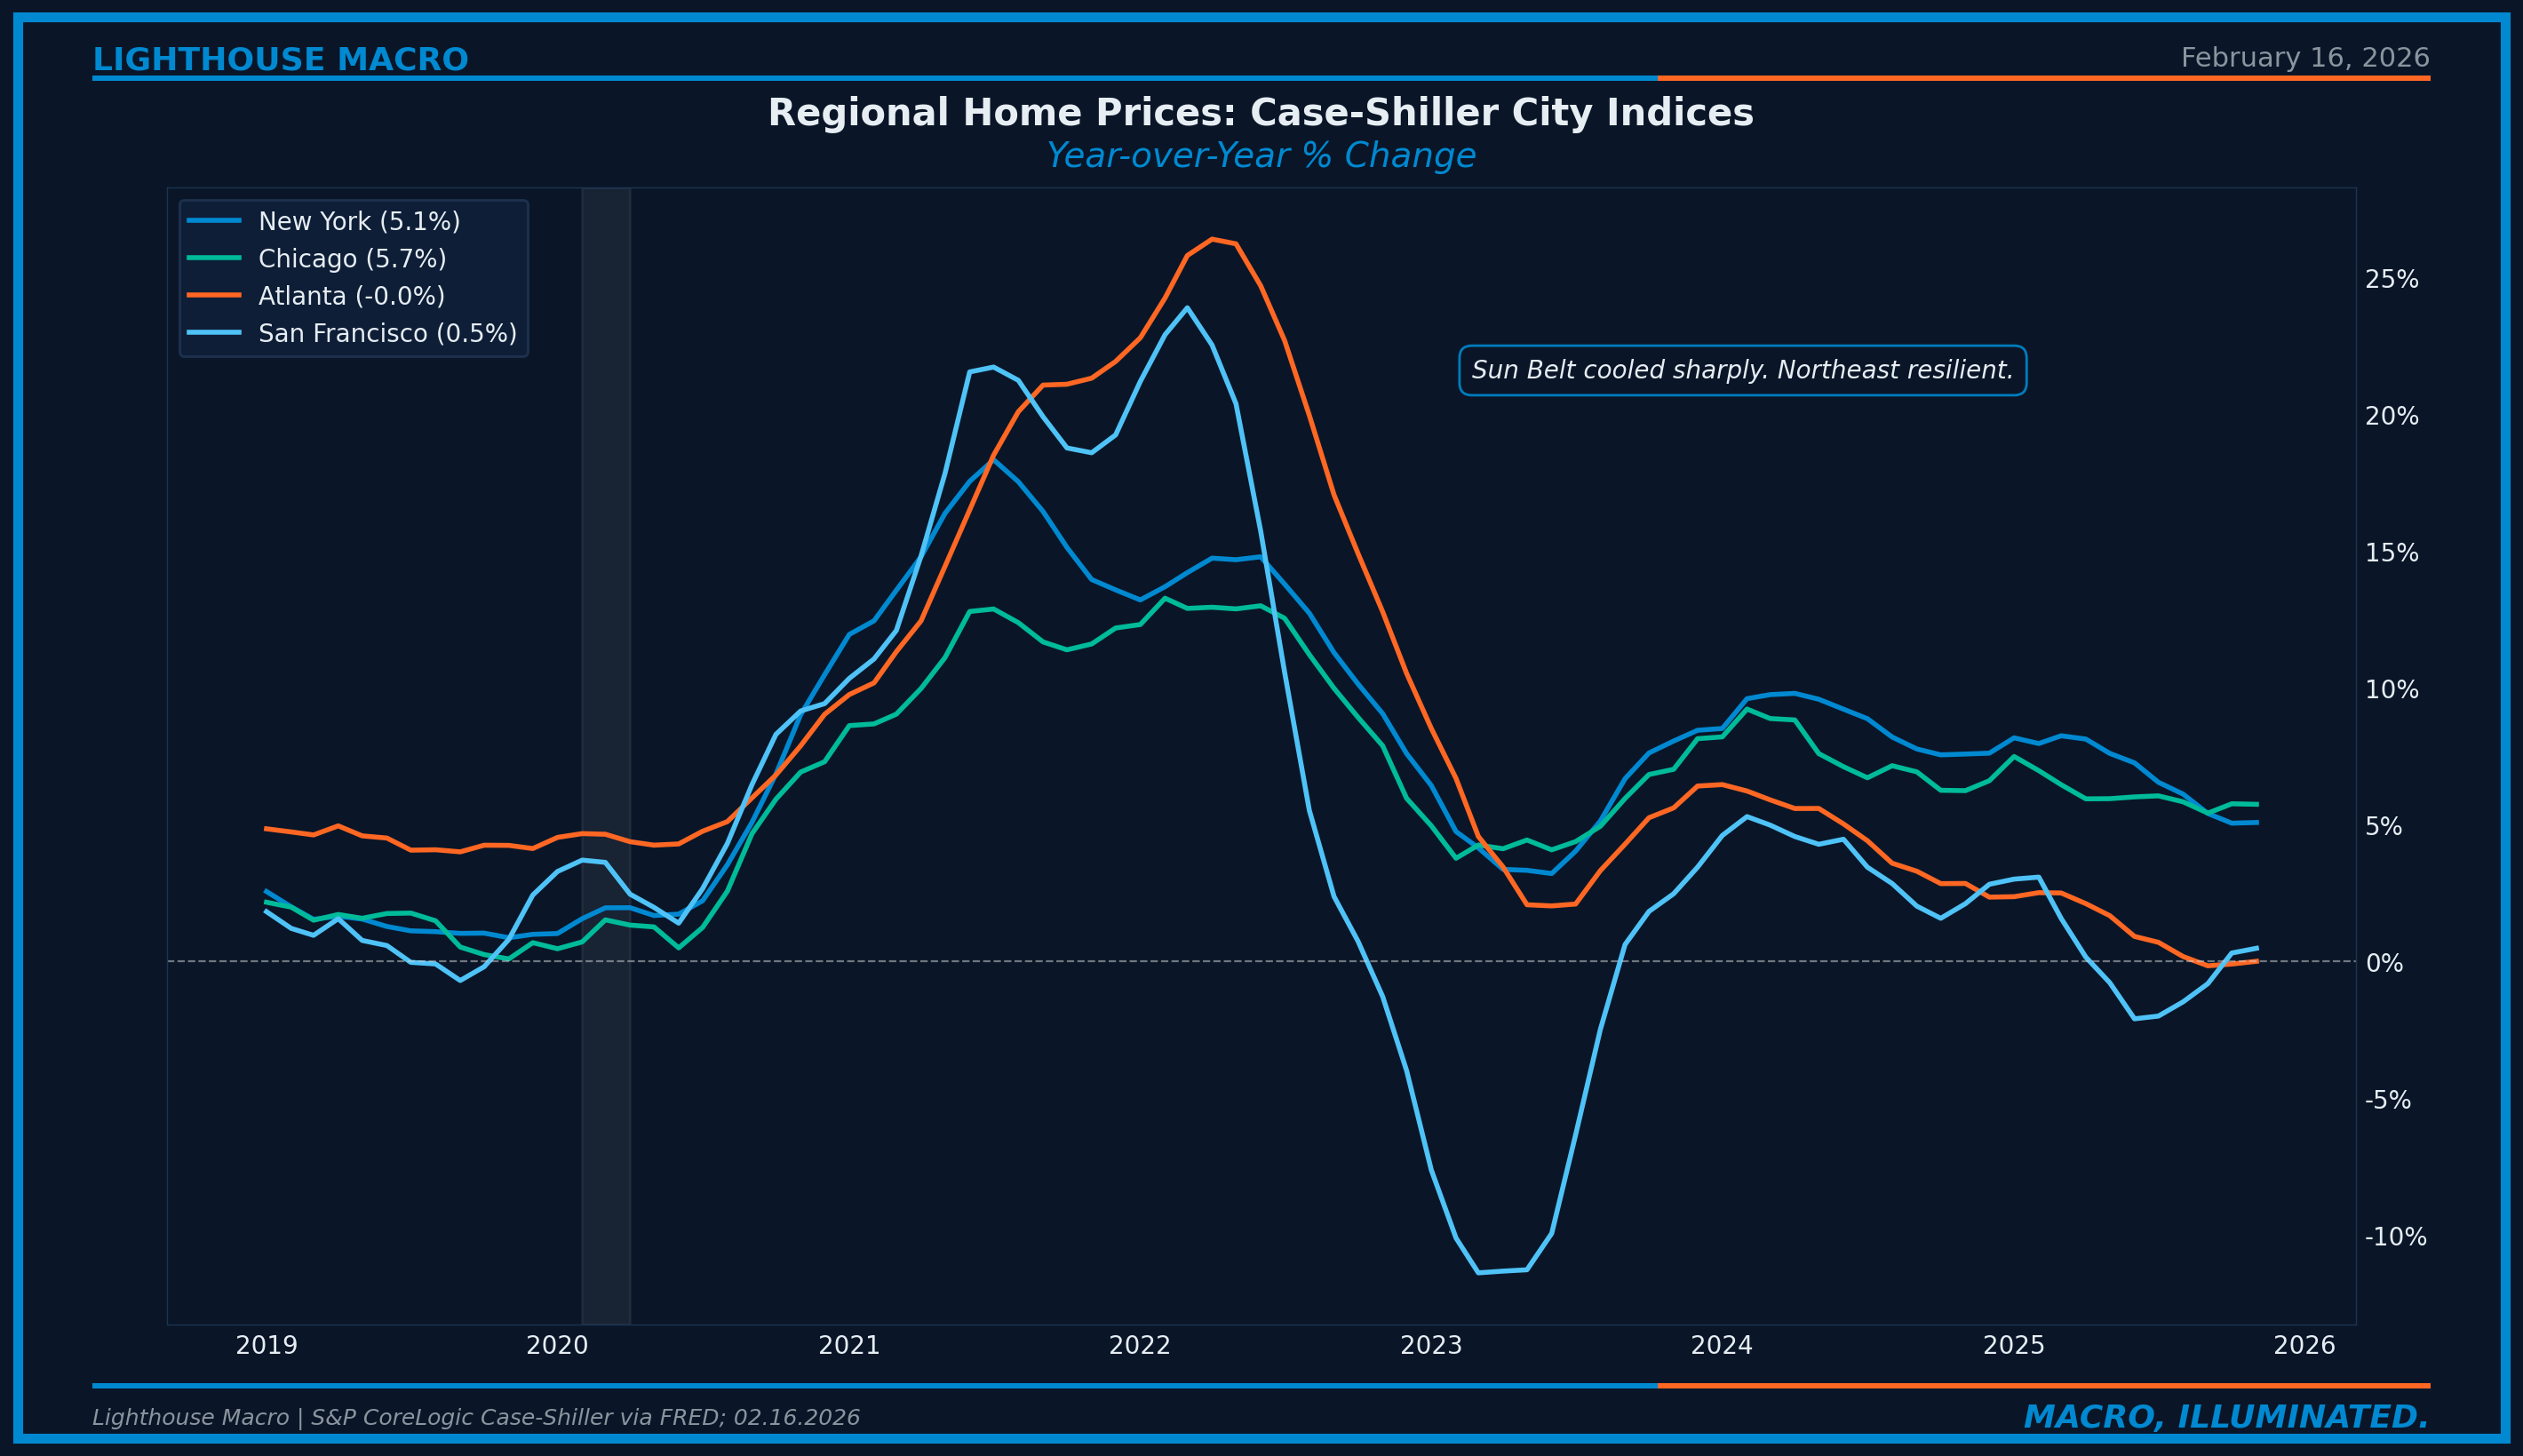
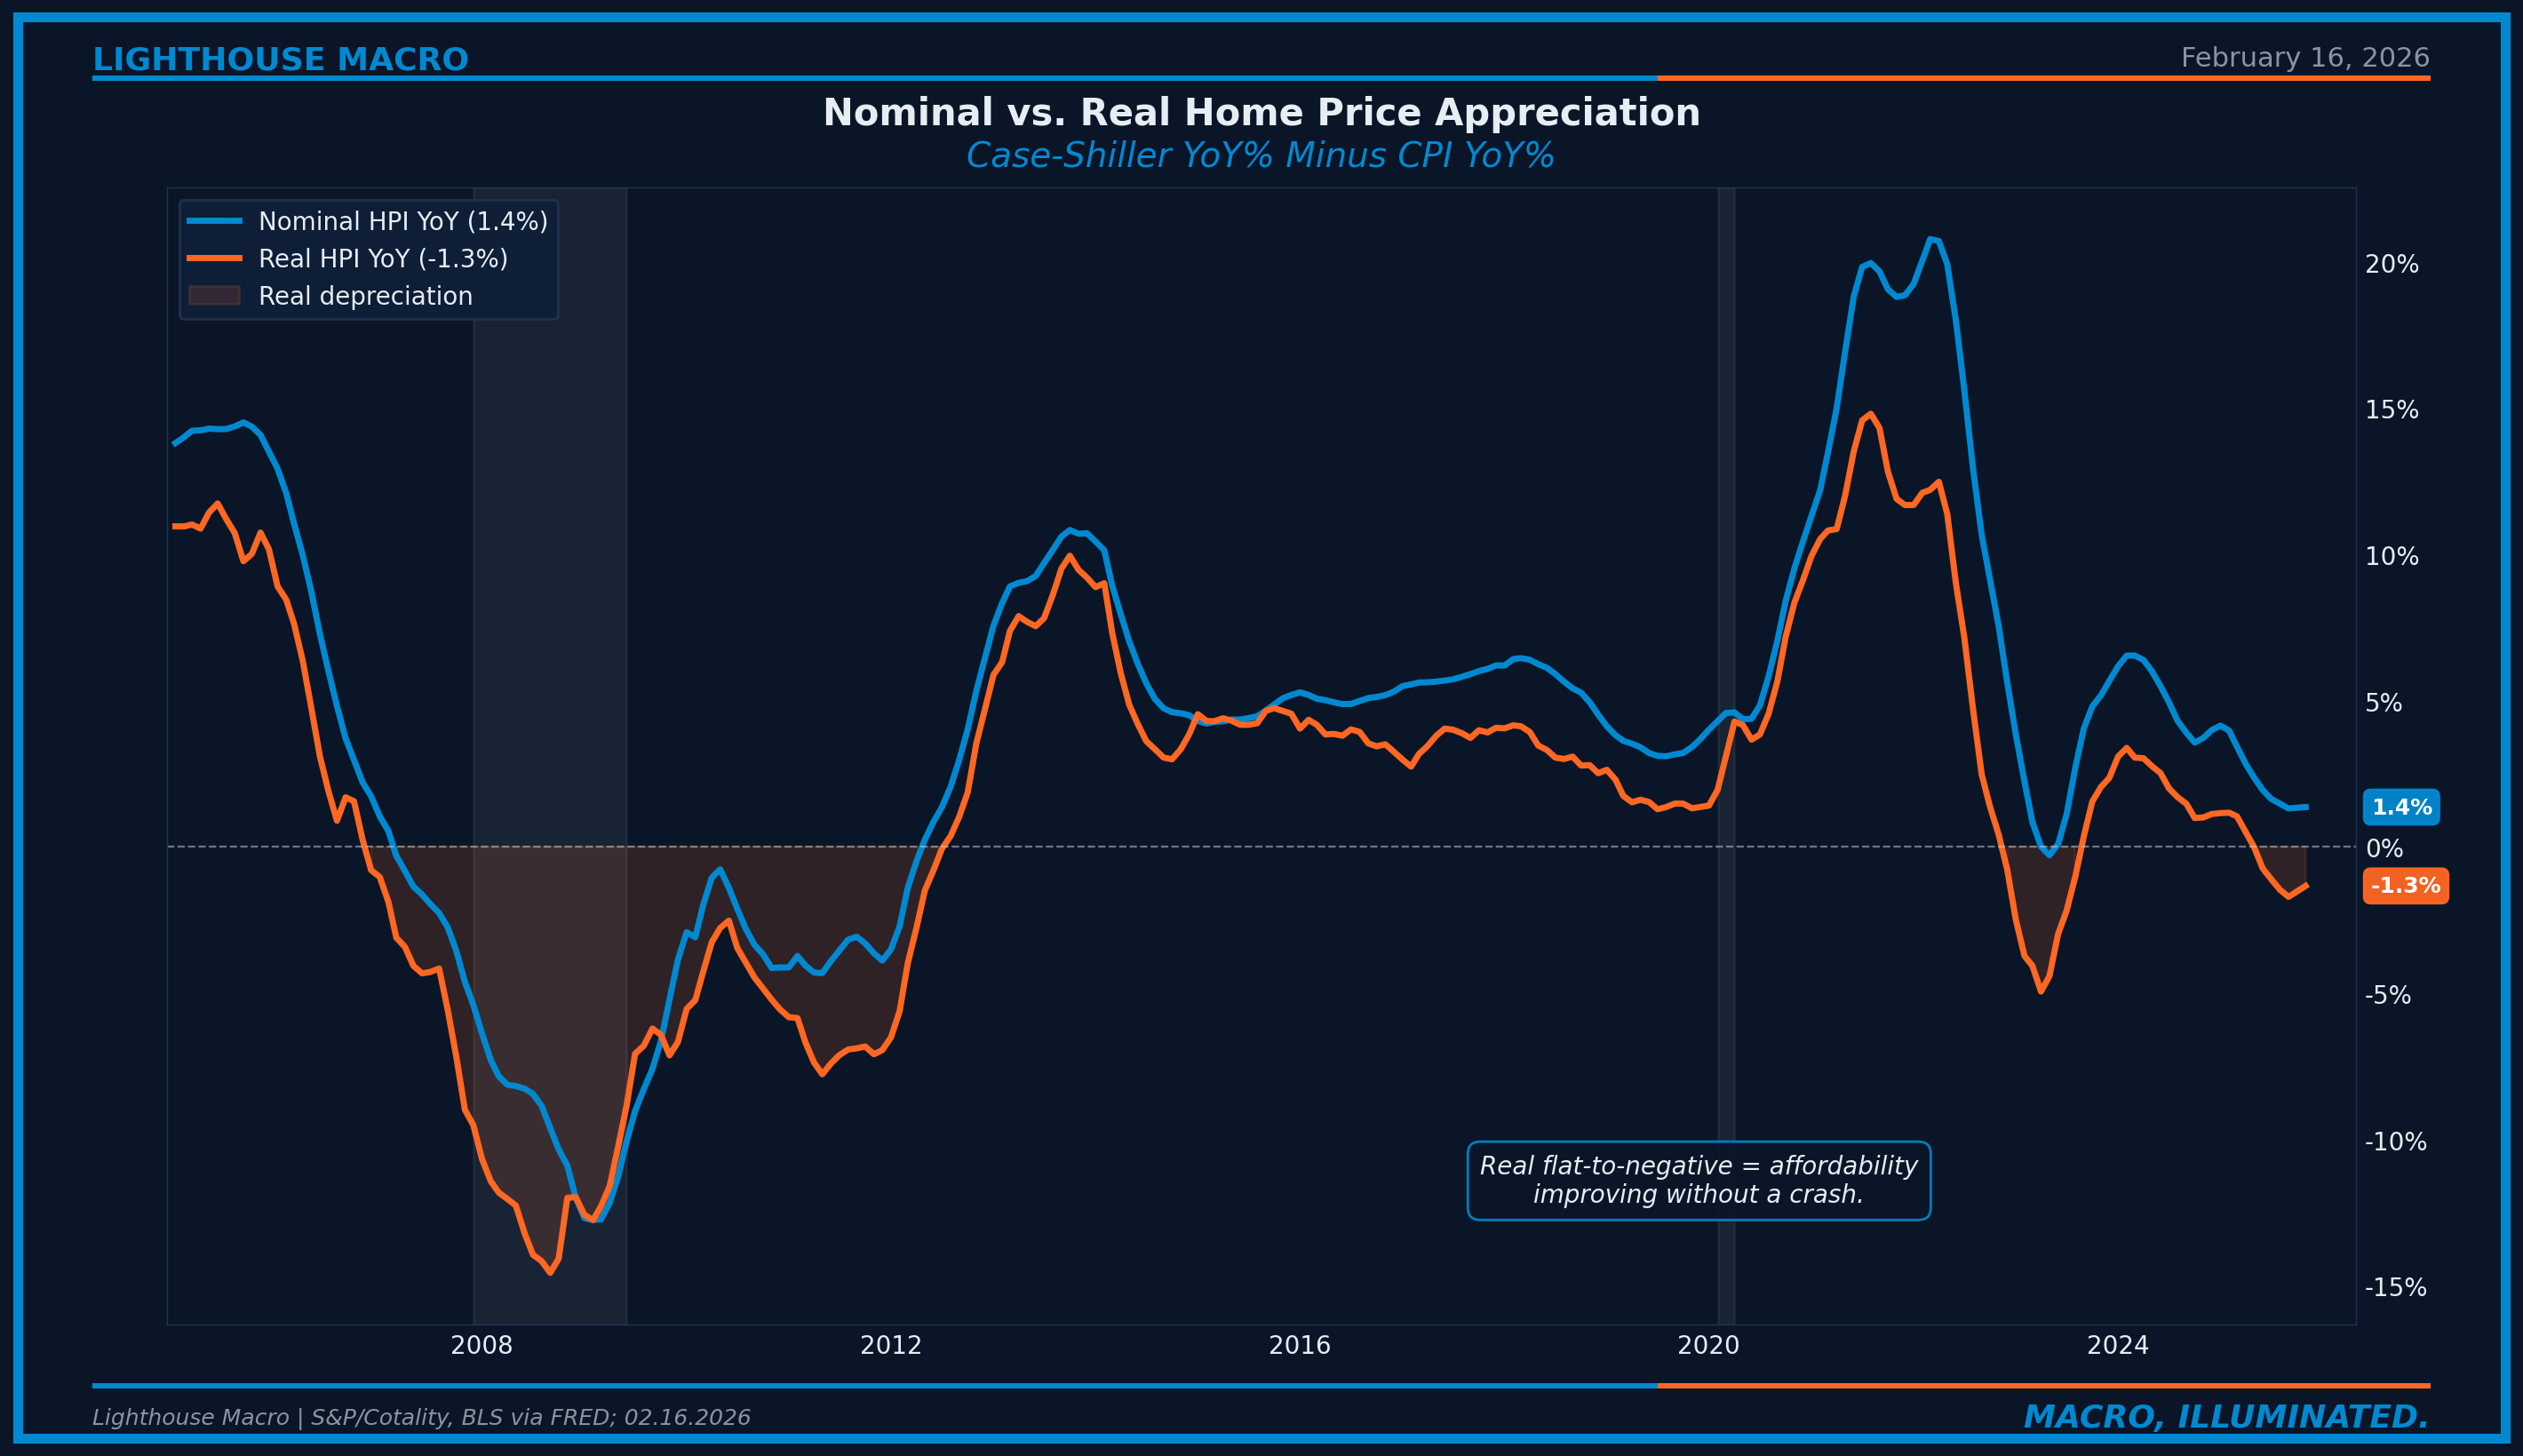
NAR’s median existing home price ($396,800, January 2026) rose 0.9% year-over-year. The Case-Shiller repeat-sales index shows 1.4%, a different methodology that controls for the mix of homes sold. Both tell the same story: low single-digit appreciation, not the double-digit gains of 2021-2022. Regional divergence is significant: New York +5.1%, Chicago +5.7%, San Francisco +0.5%, Atlanta flat. The K-shaped divergence reflects local supply dynamics, not a national trend. Supply-constrained Northeast markets are hitting new highs while Sun Belt markets return to earth.
Real home price appreciation (nominal minus CPI) is roughly flat to slightly negative, meaning housing is becoming incrementally more affordable in real terms even as nominal prices edge higher. This is the healthy resolution: wages growing faster than prices, compressing the ratio without a crash. It is also the slowest resolution. At current rates of nominal appreciation (~1-2%) and wage growth (~4%), the affordability gap closes by roughly 2-3 percentage points per year. That math implies years, not quarters, before the median household can comfortably afford the median home at prevailing rates.
Mortgage Credit Health: The Systemic Risk Gauge
This is where the current cycle diverges most dramatically from 2008.
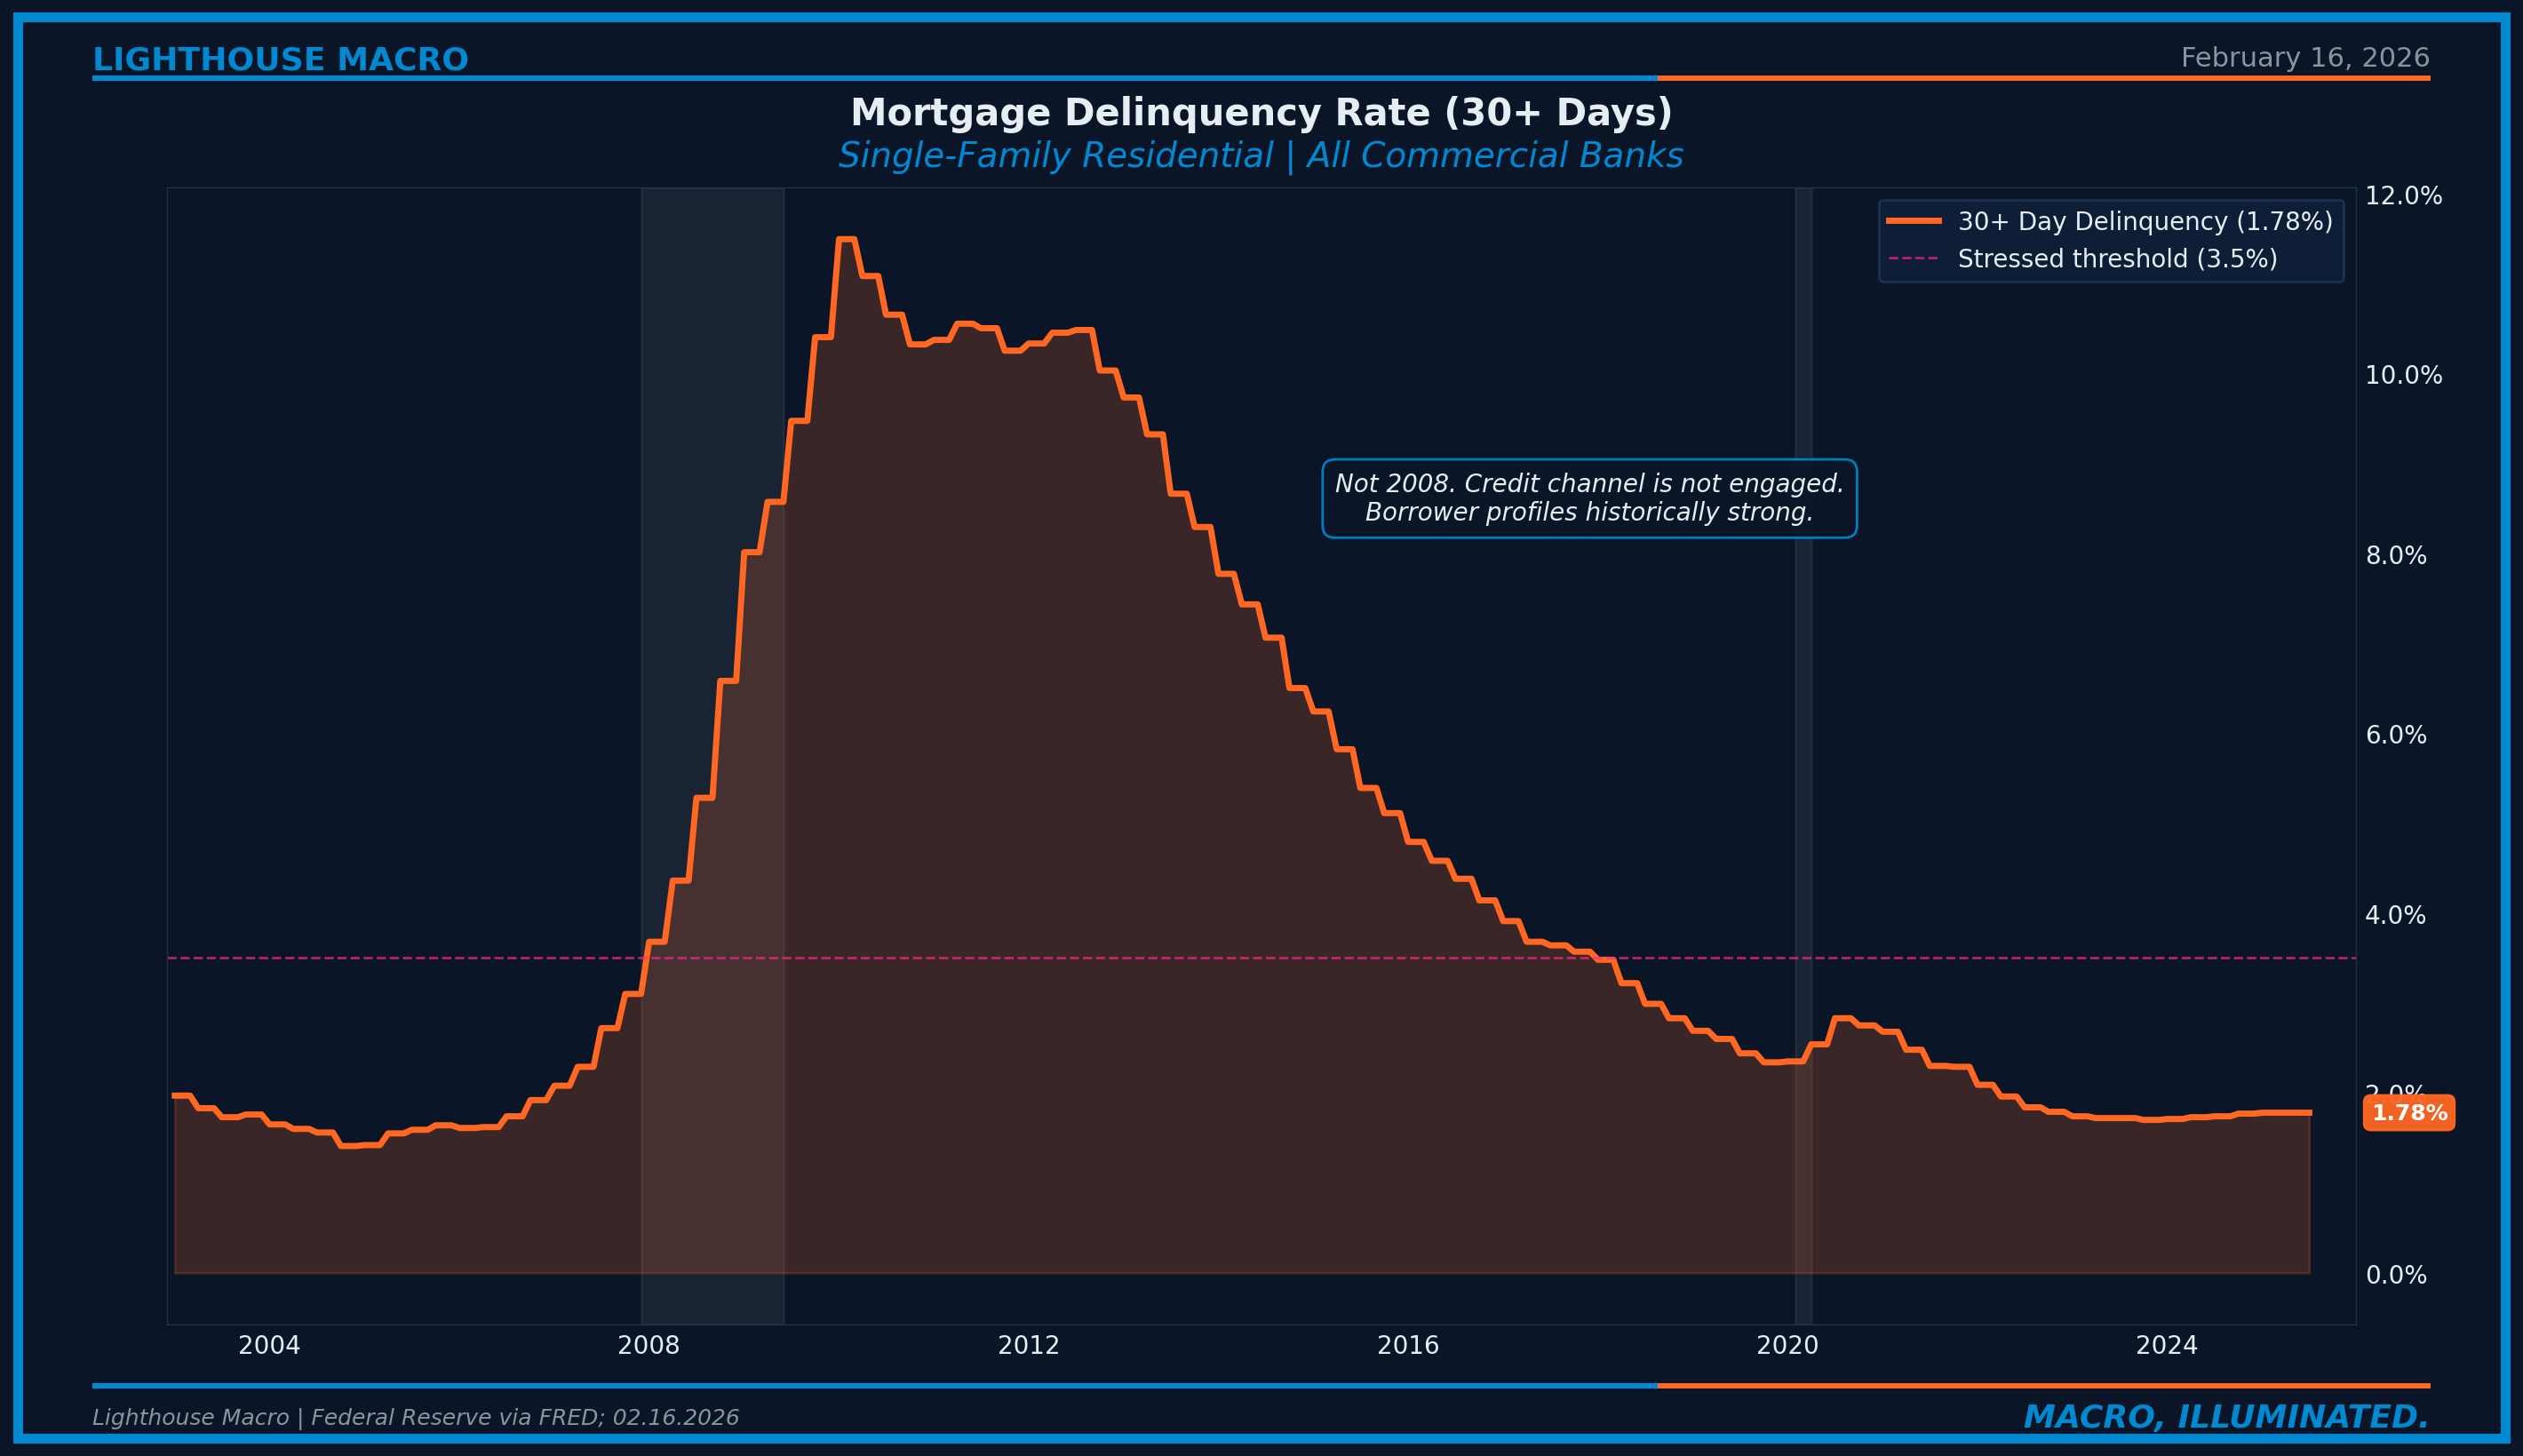
Total home equity exceeds $17 trillion. Negative equity is approximately 2.1%. Even a 15-20% price decline would leave the vast majority of borrowers above water. FHA delinquencies at ~11.5% are the leading edge to watch, elevated but well below crisis levels. Lending standards per the SLOOS have stabilized. The credit channel is not adding to housing stress.
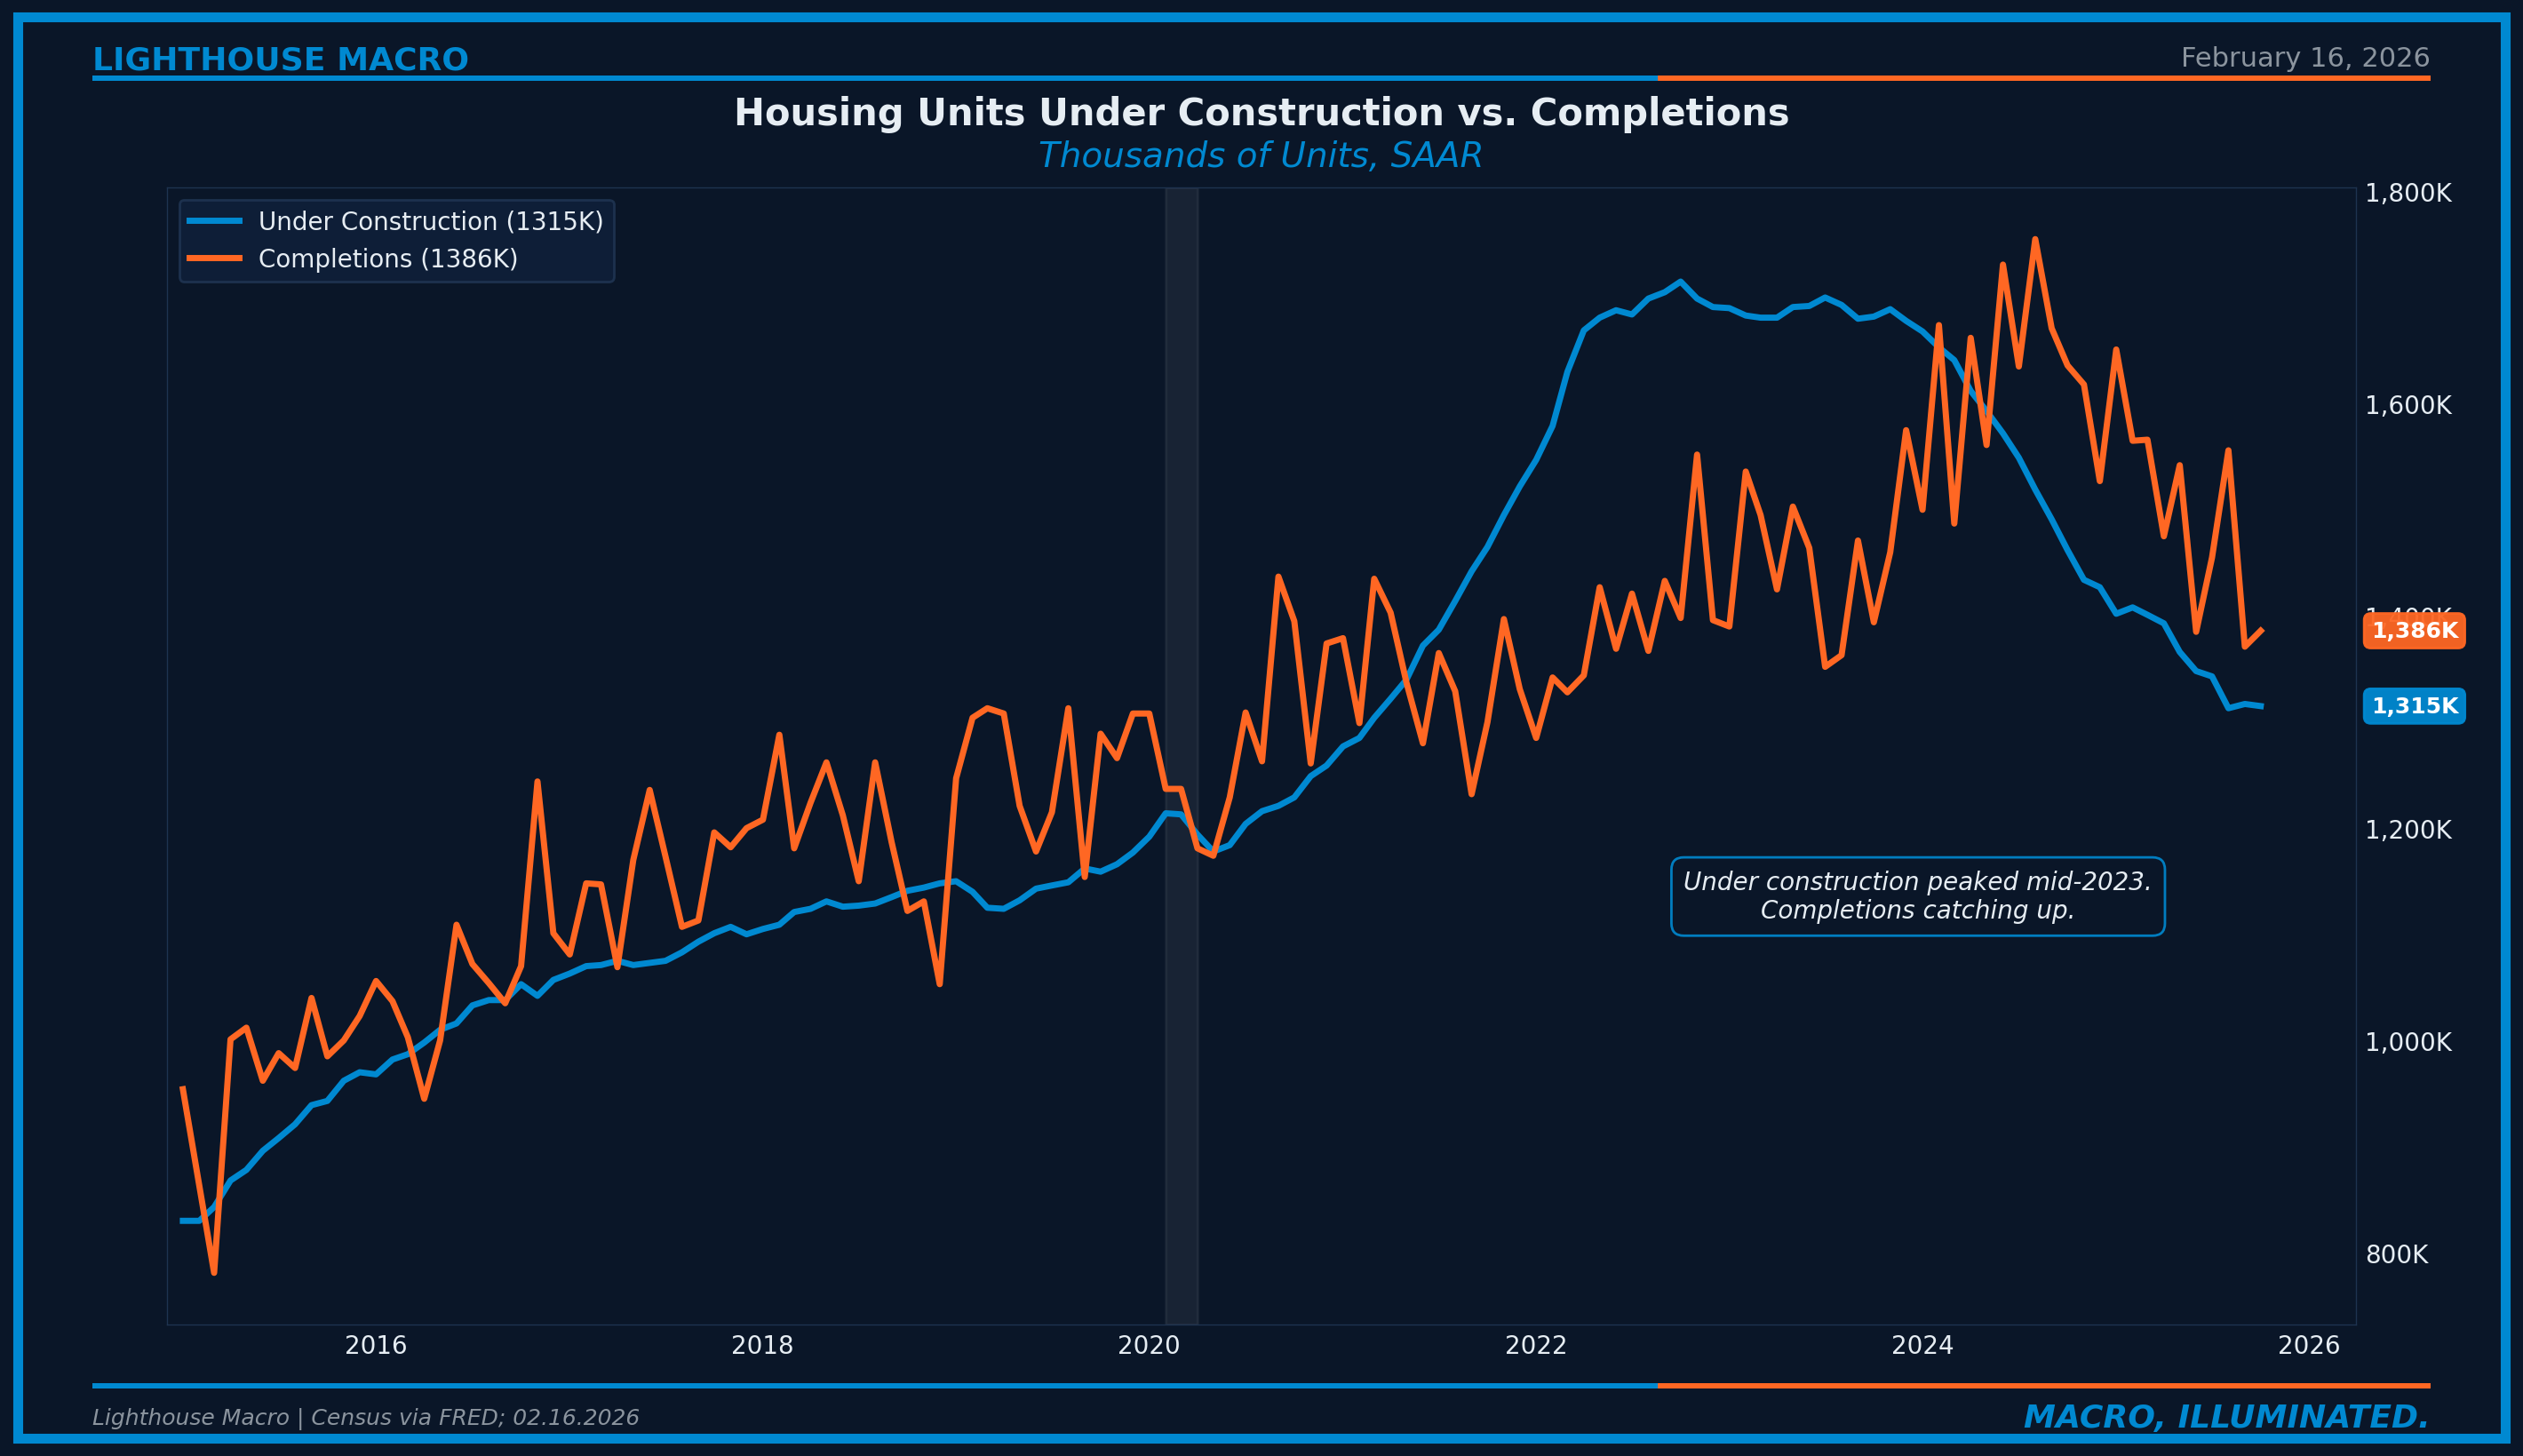
The Construction Pipeline: Supply Wave Clearing
The units already in the pipeline tell the forward story. Under-construction units peaked in mid-2023 and are now declining as completions catch up, particularly in multifamily. This MF supply wave is what’s driving rental market softness, feeding directly into the shelter disinflation that eventually pulls down CPI. National rents per Zillow are growing roughly 1.9% year-over-year, a significant deceleration from the 15%+ peaks of 2022. The buy-versus-rent calculus remains heavily skewed toward renting in most major metros, with monthly mortgage payments exceeding median rent by $800-1,200. Until that gap narrows, renters have little financial incentive to become buyers.
When construction costs rise faster than prices, builders pull back even if demand exists. Tariffs on Canadian softwood lumber (35.2%), steel (50% combined), and Chinese building materials (50%+) are adding an estimated $10,000-$20,000+ to the cost of a new home per NAHB. A tight construction labor market (30%+ immigrant workforce) and rising regulatory costs ($95,000+ per unit per NAHB) create a supply-side constraint that reinforces the structural deficit.
The Consensus Trap
Surface narrative: “Mortgage rates are coming down, affordability is improving, inventory is building. Spring 2026 will be the breakout.”
What is actually happening: Existing sales just printed the worst January in over two years. NAHB has been below 50 for 21 consecutive months. 40% of builders are cutting prices. “Most affordable since March 2022” is a low bar cleared by an inch, not a mile.
Two biases trap consensus on housing:
Level bias. Analysts focus on mortgage rate levels rather than the lock-in spread. A 6.1% rate is lower than 7.0%, true. But what matters for transaction volume is the spread between prevailing rates and outstanding mortgages. That spread remains over 200 basis points for most homeowners. Rates need to fall further, not just stabilize.
Cycle analogy bias. Comparing today to 2008 or 2019 misses the fact that this cycle has no precedent. The combination of a rate shock, golden handcuffs, structural supply deficit, and historically strong credit profiles has never occurred simultaneously. The market is not crashing, not normalizing, and not booming. It is frozen, a distinct regime.
Where We Are Now
The housing market in February 2026 sits in Stage 2: the Frozen Equilibrium.
Demand is weak but stabilizing. Sales at 3.91 million are frozen (sub-3.5M = severe distress, 4.5M+ = normal). MBA purchase applications are modestly above year-ago levels. Direction positive, level depressed.
Supply is structurally tight, cyclically easing. Months’ supply at 3.7 is approaching balanced but new construction remains below the pace needed to address the 3-4 million unit deficit.
Credit is healthy. Delinquencies low, equity cushions large, lending standards stabilized. The credit channel is not engaged. This is the single most important difference from any housing downturn in modern history.
Affordability remains the bottleneck. Rates at 6.1% are 78 basis points below a year ago, but first-time buyer participation at 31% signals the entry-level market is still locked out.
Builder outlook is pessimistic but adapting. NAHB at 37 is firmly negative, but builders are responding with incentives, rate buydowns, and a shift toward smaller, more affordable units.
Policy is mixed. The Fannie/Freddie $200 billion MBS purchase program is a direct attempt to compress mortgage spreads. Whether it works depends on spread transmission and Treasury market cooperation. Meanwhile, tariff escalation pressures construction costs and immigration enforcement could tighten the construction labor market further.
Net assessment: neutral-to-slightly-bearish on transactions, neutral-to-slightly-bullish on prices (structural deficit), firmly not-a-crisis on credit. The thaw requires rates closer to 5.5%. Neither imminent nor impossible on a 6-12 month horizon.
The Cross-Pillar Connection
Housing connects to every other pillar in the framework, but four links matter most:
Housing to Prices. The shelter-CPI bridge is the most important cross-pillar link. Shelter is 34% of CPI and 18% of Core PCE. Market rents lead official shelter measures by 12-18 months. Housing generates the “last mile” inflation lag we covered in Post 2.
Housing to Growth. Residential fixed investment is 3-5% of GDP directly, but the wealth effect amplifies its contribution. A frozen housing market contributes zero growth impulse, dragging on both residential investment and wealth-effect-driven consumption.
Housing to Consumer. The wealth effect channel: $1 of home equity generates roughly $0.05-0.08 in additional spending with a 3-6 month lag. With total home equity exceeding $17 trillion, housing wealth is the largest component of median household net worth and the buffer that determines how long consumers can sustain spending when labor softens.
Housing to Financial Conditions. Mortgage credit quality determines whether housing stress reaches the banking system. In 2008, housing was the financial crisis. In 2026, strong credit quality means housing is not a systemic risk. That is the most important single fact about this cycle.
How to Track This Pillar
Existing Home Sales. Below 3.5M = severe stress. Above 4.5M = thawing. (Monthly, NAR, ~21st)
New Home Sales. Rising new/existing ratio = resale dysfunction. Above 750K = builder strength. (Monthly, Census, ~25th)
30-Year Mortgage Rate. Below 5.5% unlocks meaningful supply. (Weekly, Freddie Mac, Thursdays)
NAHB HMI. Below 50 = negative. Below 30 = capitulation. (Monthly, NAHB, 3rd Monday)
Housing Starts. Below 1.0M = recession signal. Above 1.3M = expansion. (Monthly, Census, ~17th)
Case-Shiller National HPI. Gold standard for prices, 2-month lag. Supplement with Zillow ZHVI for real-time. (Monthly, S&P/Cotality, last Tuesday)
Zillow ZORI. 12-18 month leading indicator for CPI shelter. (Monthly, Zillow Research)
MBA Purchase Applications. Highest-frequency demand signal, leads sales by 4-8 weeks. (Weekly, MBA, Wednesdays)
Invalidation Criteria
Every thesis needs an exit door.
Bull Case (Housing Thaw) Confirmation:
If the following occur simultaneously for 3+ months, the frozen equilibrium thesis is invalidated and we should expect a sustained recovery in housing activity:
30-year mortgage rates sustain below 5.5%
Existing home sales rise above 4.5 million SAAR for 3 consecutive months
NAHB returns above 50
MBA purchase applications rise 15%+ year-over-year for 3+ months
First-time buyer share returns above 35%
Active listings rise 20%+ year-over-year (locked-in sellers relisting)
Current status: Zero of six conditions met.
Action if confirmed: Increase exposure to rate-sensitive housing equities (XHB, ITB). Reassess shelter inflation trajectory for faster deceleration.
Bear Case (Credit Contagion) Confirmation:
If the following occur, housing is deteriorating beyond a frozen market into a systemic credit event:
FHA 30+ day delinquency rate exceeds 14%
Negative equity share rises above 5%
Existing home months’ supply exceeds 6.0
Foreclosure filings increase 50%+ year-over-year for two consecutive quarters
XHB underperforms S&P 500 by 15%+ over a rolling 3-month window
SLOOS shows net tightening on residential lending exceeding 40%
Current status: Zero of six conditions met.
Action if confirmed: Reduce equity exposure broadly. Underweight housing and financials. Monitor MBS spreads for systemic stress signals.
Framework drives positioning, but the framework can be wrong. Data determines outcome.
The Bottom Line
Housing is the economy’s collateral engine. It drives consumer wealth, construction employment, shelter inflation, and credit conditions simultaneously. The sequencing: housing activity leads prices by 3-6 months, leads shelter CPI by 12-18 months, and leads consumer spending through the wealth effect with a 3-6 month lag.
Current conditions: frozen, not broken. Transactions depressed, credit quality strong, prices stable on a structural deficit that continues to widen. Affordability is the binding constraint, improving at the margin but not fast enough to unlock the golden handcuffs.
The resolution depends on rates, which depend on inflation, which depends on the shelter lag that housing itself generates. A feedback loop with a long delay. The base case is a gradual unfreezing. The risk case is an economic shock that forces selling into a market with insufficient demand. The framework tells you which indicators to watch for each scenario. The data will tell you which one is unfolding.
This is how we analyze housing.
Bob Sheehan, CFA, CMT
Founder & CIO, Lighthouse Macro
This is the 5th in a 12-part series on the Lighthouse Macro framework.
Next up: Business Investment and the Forward Commitment.