

Why Most Americans Don’t Care About Your Market Call (And Why That Matters)
Introducing the framework behind Lighthouse Macro.

Most macro commentary ends the same way: “...so we’re overweight equities” or “...which is why we prefer duration.”
That’s fine if you’re managing a portfolio. It’s what I do. Last week, I launched Lighthouse Crypto Macro with live-tracked positioning. The whole global macro book, covering equities through commodities, is coming next. When I say we’re defensive, you’ll see it. When we add risk, the same thing. Investment conclusions backed by transparent positioning.
But there’s a gap I keep noticing.
Two Economies
Last week, I published a thread breaking down the American consumer. Not the aggregate. The actual composition.
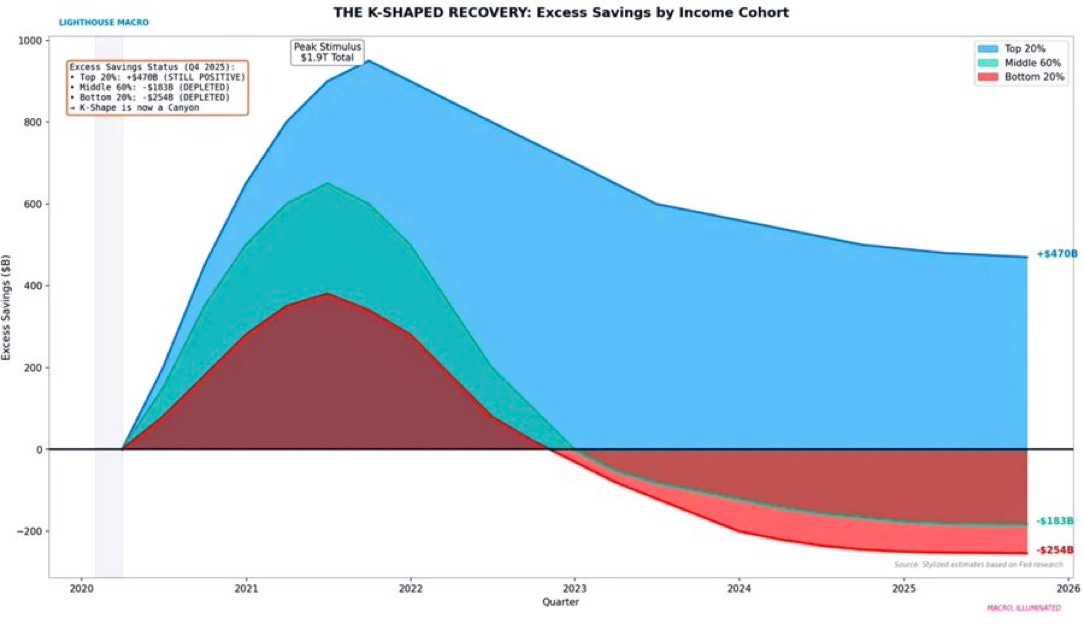
Start with savings. The top 20% of households still hold $470 billion in excess pandemic savings. That’s the cushion they built during lockdowns, and it’s still there. The bottom 80%? Underwater by $437 billion combined. The cushion isn't gone. It was never there to begin with for most of them.
This isn’t a gap. It’s two different economies wearing the same headline.
It gets worse the deeper you look.
Subprime Auto
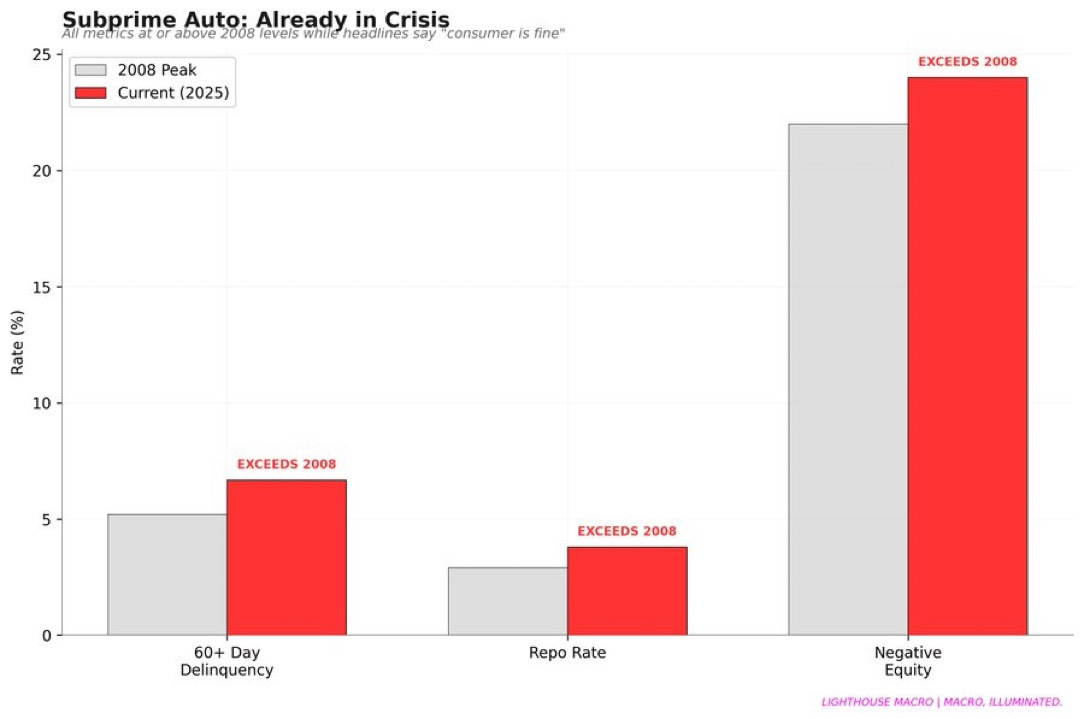
If you want to see stress before it shows up in unemployment claims, look at car payments. 60+ day delinquencies are at 6.6%. The repo rate (how often lenders physically repossess vehicles) is 3.7%. Negative equity, where borrowers owe more than the car is worth, sits at 23.7%.
All three metrics now exceed their 2008 peaks.
That’s not a typo. The subprime auto market is in worse shape today than it was heading into the financial crisis. The difference is nobody’s making a movie about it.
Labor Bifurcation
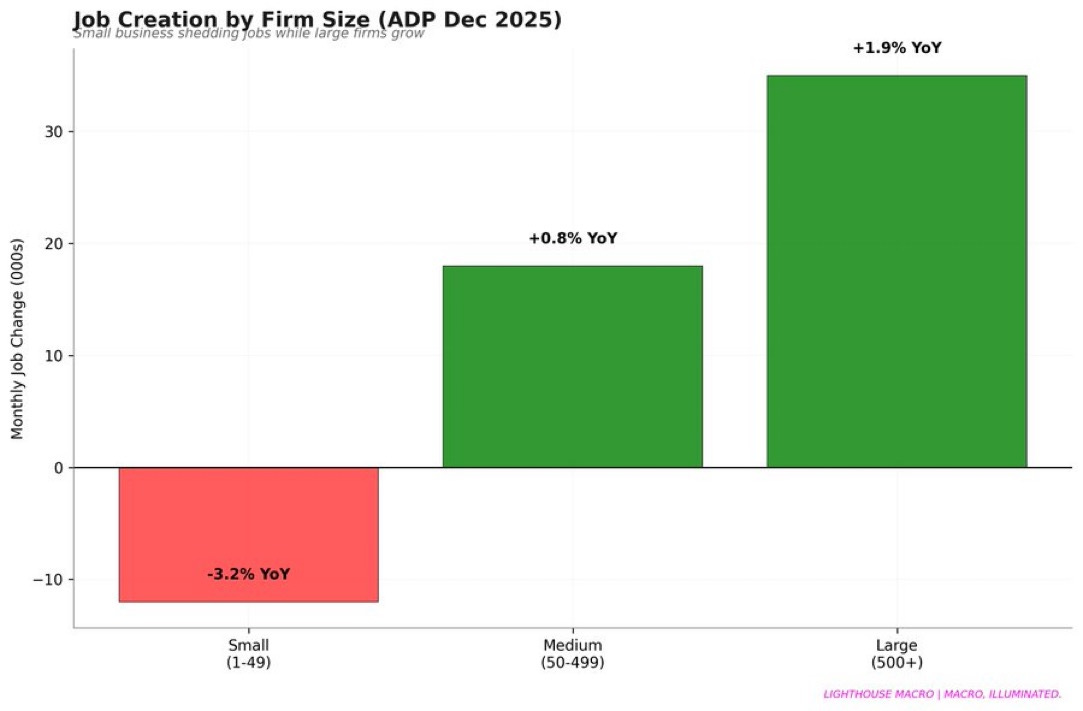
Small businesses (those with 1 to 49 employees) are shedding jobs at a rate of -3.2% year-over-year. Large firms with 500 or more employees grew payrolls by +1.9% over the same period.
Here’s why that matters: small businesses employ the bottom 80%. Large firms employ the top 20%.
When the BLS reports “solid job gains,” they’re averaging a contraction and an expansion. The headline looks fine. The composition doesn’t.
The Inequality of “Average”
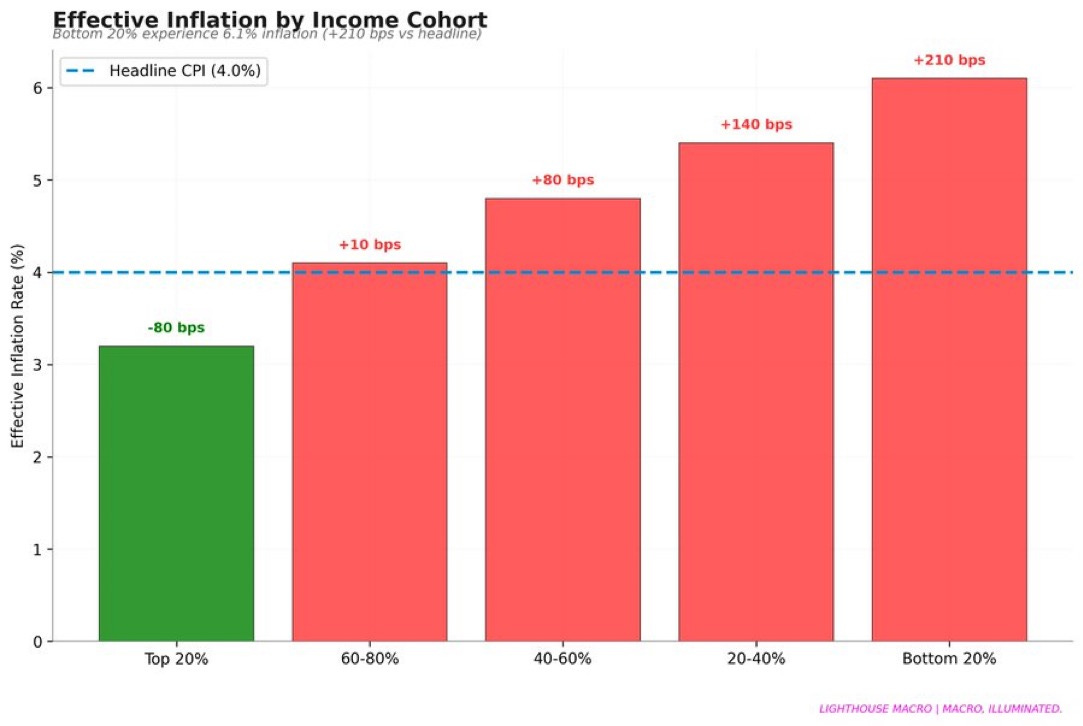
Inflation doesn’t hit everyone equally. The top 20% experiences an effective inflation rate of around 3.2%. The bottom 20%? Closer to 6.1%.
The difference is exposure. Shelter, food, and energy make up a larger share of spending for lower-income households. When those categories run hot, the pain concentrates at the bottom. Inflation is a regressive tax, and it’s been grinding for three years.
Savings rates tell the same story from the other direction. The top 10% of earners save 18% of their income. The bottom 60%? Just 1.2%. They’re not building a buffer. They’re surviving month to month.
The investment read writes itself: be selective in consumer discretionary, watch credit stress in lower-income cohorts, don’t trust aggregate spending data.
But here’s the thing.
If you’re a regional credit union, that subprime auto data should change your lending standards. If you’re a manufacturer deciding on capacity expansion, that labor bifurcation matters. If you’re a retailer serving the bottom 80%, that spending data explains why your customer is trading down.
Same analysis. The first group gets a portfolio tilt. The second group gets an operational insight. Both are valuable. Only one audience has been served.
The Gaps
There’s a gap between institutional research and what’s available to retail traders.
There’s a gap between market-focused research and policy economics: different disciplines, different questions, different audiences.
But the widest gap? Between all of the above and regular people. Small business owners. Workers trying to gauge job security. Anyone who senses something’s off but doesn’t have the framework to decode it.
Most economic analysis either ends with a ticker symbol or gets published in journals nobody reads. The person running a 15-person company, deciding whether to hire or hold off, has almost nowhere to go. They’re left with headline GDP, the unemployment rate, whatever the TV says. Surface-level stuff that often misleads more than it informs.
I remember being in high school during the financial crisis, listening to news about collapsing housing and disappearing jobs. My parents weren’t traders. They weren’t rebalancing a portfolio. But the crisis hit them anyway.
That stuck with me.
Not a Pivot. An Expansion.
I’ve spent my career doing research and managing money for institutional clients. The work is rigorous. The audience is narrow. And the output almost always lands on a market call.
This series is me doing two things at once: showing the current audience the depth of process behind my positioning, and opening a door for people who could use the same analysis but have been left out because nobody’s framed it for them.
Over the next several weeks, I’m going to walk through the framework I use to analyze the economy and position portfolios. Twelve pillars. Three engines. A layered system that tells me both where we are and where we’re heading.
Engine 1: Macro Dynamics (Pillars 1-7)
Labor. Prices. Growth. Housing. Consumer. Business. Trade.
This is the real economy. The machinery. The labor cycle drives the machine: worker confidence drives wage pressure, wages drive spending, spending drives revenue, revenue drives hiring. It’s a feedback loop. When it’s virtuous, expansions extend. When it cracks, the cracks spread.
The quits rate is the economy’s truth serum. When workers stop quitting, they’re seeing something management hasn’t admitted yet. Every recession since 1990 was preceded by quits falling below 2.0%. We’re at 1.9%.
Engine 2: Monetary Mechanics (Pillars 8-10)
Government. Financial. Plumbing.
A lot of people find this part boring. I find it fascinating. The reverse repo facility is draining toward zero. The gap between what credit spreads are pricing and what labor fragility is signaling. Dealer balance sheet constraints that determine whether liquidity actually transmits into markets. Most of this happens in the background until it doesn’t.
I came up trading equities and managing multi-asset portfolios. But understanding what drives those markets pulled me deeper into the plumbing: reserves, repo, the standing facilities, stablecoin collateral chains. The transmission matters as much as the mechanism.
Engine 3: Market Structure (Pillars 11-12)
Trend, Momentum, and Internal Mechanics.
Macro tells us what should happen. Market structure tells us what is happening.
We use Trend, Momentum, and Relative Strength to bridge the gap between economic theory and market reality. While these are often used as bottom-up tools for picking stocks, they are vital for determining our top-down stance. If our macro models scream ‘buy’ but the market (or a specific region or sector) is locked in a structural downtrend, we stand down. We watch Relative Strength to see where capital is actually flowing, and we respect Momentum as the final arbiter of timing.
With that said, much like headline employment numbers, the averages often hide what’s really happening underneath.
Fundamentals drive the destination, but flows drive the path. This engine measures the market’s structural integrity. Is a rally supported by broad participation across sectors, or is it just three mega-caps masking rot beneath the surface? Is sentiment so euphoric that there’s nobody left to buy?
We don’t look at technicals to predict the future; we look at them to risk-manage the present. When the macro data says “go” but market structure shows failing breadth or extreme positioning, we wait.
Macro sets the thesis. Market structure determines the exposure.
All twelve pillars feed into a three-layer output: recession probability, warning signals, and regime classification.
Current regime: Elevated Risk. We’re defensive.
Why Show the Process?
For the current audience: When I publish a call or take a position, you’ll have seen the machinery at work. Not “trust me.” Here’s what I watch, here’s what it’s saying, here’s what would change my mind. Strong views, weakly held. Confident, but humble.
For the broader audience: The same analysis that drives portfolio positioning can inform business decisions, hiring timing, credit standards, and pricing strategy. You’ve just never had it framed that way.
How This Works
Each post covers one pillar. Same structure:
What it is: The indicators and what they measure.
Why it matters: The transmission mechanism. How this connects to everything else.
How to track it: Where the data lives, what thresholds matter.
Invalidation: What would change my view.
We start with Labor (Pillar 1). It leads everything, so it goes first.
By the end, you’ll have a framework. Maybe you adopt it wholesale. More likely, you take what’s useful and fold it into your own process. Either way, you’ll understand the gears.
Over the next several weeks, I’m going to show you how I see the economy. Whether you use it to position a portfolio, run a business, or make sense of the noise, that’s your call.
Bob Sheehan, CFA, CMT
Lighthouse Macro
exactly what i was searching for! looking forward to the series