

Sentiment & Positioning: The Contrarian Edge
Diagnostic Dozen, Pillar 12 of 12

The AAII Bull-Bear spread printed -7.3% for the week ending April 8, the fourth straight week of elevated bearish readings. But the VIX sits at 19.2, 14% below its 50-day moving average. The VIX/VIX3M term structure is in deep contango at 0.88. Breadth has repaired: 54% of S&P 500 stocks are above their 200-day moving average, the index itself is +2.3% above its 200-day, and money market fund assets remain near record highs. The tape says “calm.” Retail says “scared.” Both can’t be right.
Scroll through financial Twitter and you’ll find two camps shouting past each other. One says the tariff selloff was overdone and the ceasefire rally proves it. The other says the macro is deteriorating and the bounce is a trap. Both camps are convinced. Both have already positioned accordingly.
That’s the point. When conviction runs high in either direction, the crowd has already acted on its beliefs. The marginal buyer or seller, the one who moves price from here, is on the other side. Sentiment doesn’t tell us who’s right. It tells us who’s left.
This is the final pillar. Not because it matters least, but because it matters differently. The first eleven pillars, from labor to market structure, tell you what’s happening in the economy and markets. Pillar 12 tells you what the crowd thinks about it, and more importantly, how they’ve positioned around those beliefs. That positioning is the raw material for the next move.
Core Insight: The Crowd Is a Liquidity Source, Not an Information Source
Sentiment isn’t noise. It’s the crowd’s positioning expressed through surveys, options, and flows. And the crowd is a source of liquidity, not information.
The transmission chain runs in a predictable loop:
Fear → Underexposure → Forced Buying →
Price Rise → Confidence → Overexposure →
Complacency → Forced Selling → Fear (Cycle)
The crowd isn’t wrong because they’re stupid. They’re wrong because they’re late. By the time everyone is bullish, they’ve already bought. The pool of marginal buyers is drained. By the time everyone is bearish, they’ve already sold. The pool of marginal sellers is exhausted. The answer to “who’s left?” determines direction.
Below -20% on the AAII Bull-Bear spread, forward 12-month returns average over 15%. Above +30%, they average well below the long-run norm. These aren’t backtested curiosities. They’re the mechanical result of positioning asymmetry. When everyone is out, the only flow that can occur is back in.
But here’s the critical caveat: sentiment only matters at extremes. In the middle, it’s noise. We don’t trade sentiment. We use sentiment to size and time trades identified by fundamentals and structure. It’s the final overlay, not the first input. The first eleven pillars tell you what to do. Pillar 12 tells you how much and when.
Our framework captures four dimensions of sentiment, each measuring a different facet of the crowd’s positioning:
Retail Sentiment: AAII surveys, Investor Intelligence. The masses. Most reliable contrary indicator at extremes because retail investors are the last to act and the most emotionally driven.
Professional Positioning: NAAIM exposure, COT data. The managers. More capital, better information, but similar emotional biases at extremes. When NAAIM shows 100%+ exposure, even the professionals have lost discipline.
Options Positioning: Put/Call ratios, VIX, term structure. The hedgers. Real-time fear measurement. This is the fastest-moving dimension and the most useful for timing.
Fund Flows: ETF flows, money market assets. The capital. Where money is actually moving, not just what people say they think.
Together, these synthesize into a single composite: the Sentiment & Positioning Index (SPI).
What to Watch: The Sentiment & Positioning Index (SPI)
The SPI synthesizes all four sentiment dimensions into a single z-score composite. The convention is critical and sometimes counterintuitive: high SPI = fear = contrarian bullish. Low SPI = euphoria = contrarian bearish. We invert the crowd’s mood because we’re measuring opportunity, not agreement.
The SPI is built from eight components spanning all four sentiment dimensions. Each is z-scored against its own history and combined using proprietary weights calibrated to their empirical contribution to forward equity returns at sentiment extremes. The components:
Put/Call Ratio (10-day smoothed): Real-time hedging demand. When the smoothed equity put/call ratio spikes above 1.1, institutions are paying up for protection. That’s not cheap talk. That’s capital at risk.
VIX vs. 50-day MA: Fear relative to recent context. The VIX level alone is misleading. A VIX at 25 that just spiked from 14 is an acute fear event. A VIX at 25 that’s been grinding there for months is background noise. The deviation from the 50-day captures the shock.
AAII Bull-Bear Spread (inverted): The longest-running retail sentiment series with a proven contrarian track record. Inverted so that extreme bearish readings push SPI higher (more contrarian opportunity).
NAAIM Exposure (inverted): Professional positioning. Actual allocation decisions by active managers. When NAAIM exceeds 100%, managers are levered long. When it drops below 25%, they’ve panic-sold. Neither state is sustainable.
Investor Intelligence Bull-Bear (inverted): Newsletter writer sentiment. A secondary retail gauge with a longer history than AAII.
ETF Equity Flows, 20-day (inverted): Capital flows. Where money is actually moving, not just what people say they think. Sustained outflows push SPI higher.
VIX Term Structure (Backwardation): Acute vs. chronic fear. Backwardation is rare and significant: near-term protection costs more than longer-dated, meaning institutions are scrambling for immediate hedging.
Money Market Fund Assets (YoY): The cash mountain. Rising MMF assets = cash on sidelines = future buying power.
The exact weights, z-score methodology, and lookback calibration are proprietary. What we can share: options-based indicators carry more weight than survey-based ones because they reflect actual capital commitment, not just stated opinion. And the inversions ensure the SPI convention holds: high SPI = fear = contrarian bullish.
The Indicators
AAII Bull-Bear Spread
The American Association of Individual Investors has been surveying its members since 1987. Every week, they ask a simple question: are you bullish, bearish, or neutral on the stock market over the next six months? The bull-bear spread, the difference between the bullish and bearish percentages, is one of the most studied contrarian indicators in equity markets.
The signal is simple. When the spread exceeds +30%, the crowd is euphoric and forward returns suffer. When it falls below -20%, the crowd has capitulated and forward returns are strong. In the middle, there’s no contrarian edge. You’re just measuring noise.
What makes AAII valuable isn’t sophistication. It’s consistency. The methodology hasn’t changed in nearly four decades. The sample is self-selecting (individual investors who care enough to respond), which makes it a clean read on retail conviction. And the contrarian track record is remarkably stable: extreme bearish readings have preceded positive 12-month returns in over 85% of historical instances.

Look at the historical pattern. The 2008 financial crisis drove the spread to nearly -50%. The 2020 COVID crash saw a plunge below -40%. The 2022 bear market bottom formed with readings in the -30% range. Each of those extremes preceded strong recoveries. Not because sentiment predicted the recovery, but because the selling was exhausted.
The current reading at -7.3% isn’t a contrarian extreme, but the persistence matters. Bears have printed 43.0%, 51.4%, 49.8%, 52.0% over the past four weeks. When retail is stuck in the high-40s/low-50s on bearish readings for a month while the tape quietly repairs, you’re watching a slow-motion divergence. Not a trade yet. But on the clock.
AAII Components: The Composition Matters
The spread is the headline, but the components tell a richer story. The breakdown into bullish, bearish, and neutral percentages reveals something the spread alone can’t: the crowd’s conviction level.
When neutral readings compress below 25%, the crowd has picked a side with conviction. They’re either enthusiastically bullish or aggressively bearish. That conviction, regardless of direction, marks an extreme. The crowd rarely reaches consensus and maintains it. Conviction compression is the setup. Mean reversion is the outcome.
When neutral is high (above 35%), nobody cares. Apathy isn’t a contrarian signal. It’s just quiet. Trade structure and fundamentals when the crowd is disengaged.

The stacked area chart makes the regime shifts visible. Notice how bear-dominant readings in late 2022 and mid-2023 preceded rallies, while bull-dominant readings in early 2024 preceded corrections. The pattern isn’t mechanical (sentiment doesn’t predict with timing precision), but the directional bias at extremes is statistically robust.
Currently: bulls at 35.7%, bears at 43.0%, neutral at 21.3%. That’s a crowd with conviction on the wrong side. Neutral has compressed to 21.3%, well below the 25% threshold, meaning retail has picked a side. And they’ve picked bearish for a month while the VIX collapsed and breadth repaired. Conviction compression plus persistent pessimism plus healing internals is a setup to watch closely.
VIX vs. 50-Day Moving Average
The VIX is the most widely quoted “fear gauge” in markets. It measures 30-day implied volatility on S&P 500 options. When institutions are scared, they buy puts, and implied volatility rises. Simple enough. But the VIX level alone is a terrible indicator.
Why? Because 25 means different things at different times. A VIX at 25 that just spiked from 14 is an acute fear event. A VIX at 25 that’s been grinding around that level for months is a market that’s simply pricing in higher uncertainty. The first is a contrarian opportunity. The second is background noise.
That’s why we measure VIX relative to its 50-day moving average. The percentage deviation from the recent average captures the shock, the sudden repricing of fear that creates dislocations and opportunities. Our threshold is +30%: when the VIX trades 30% or more above its 50-day MA, hedging demand has spiked enough to create a meaningful contrarian signal
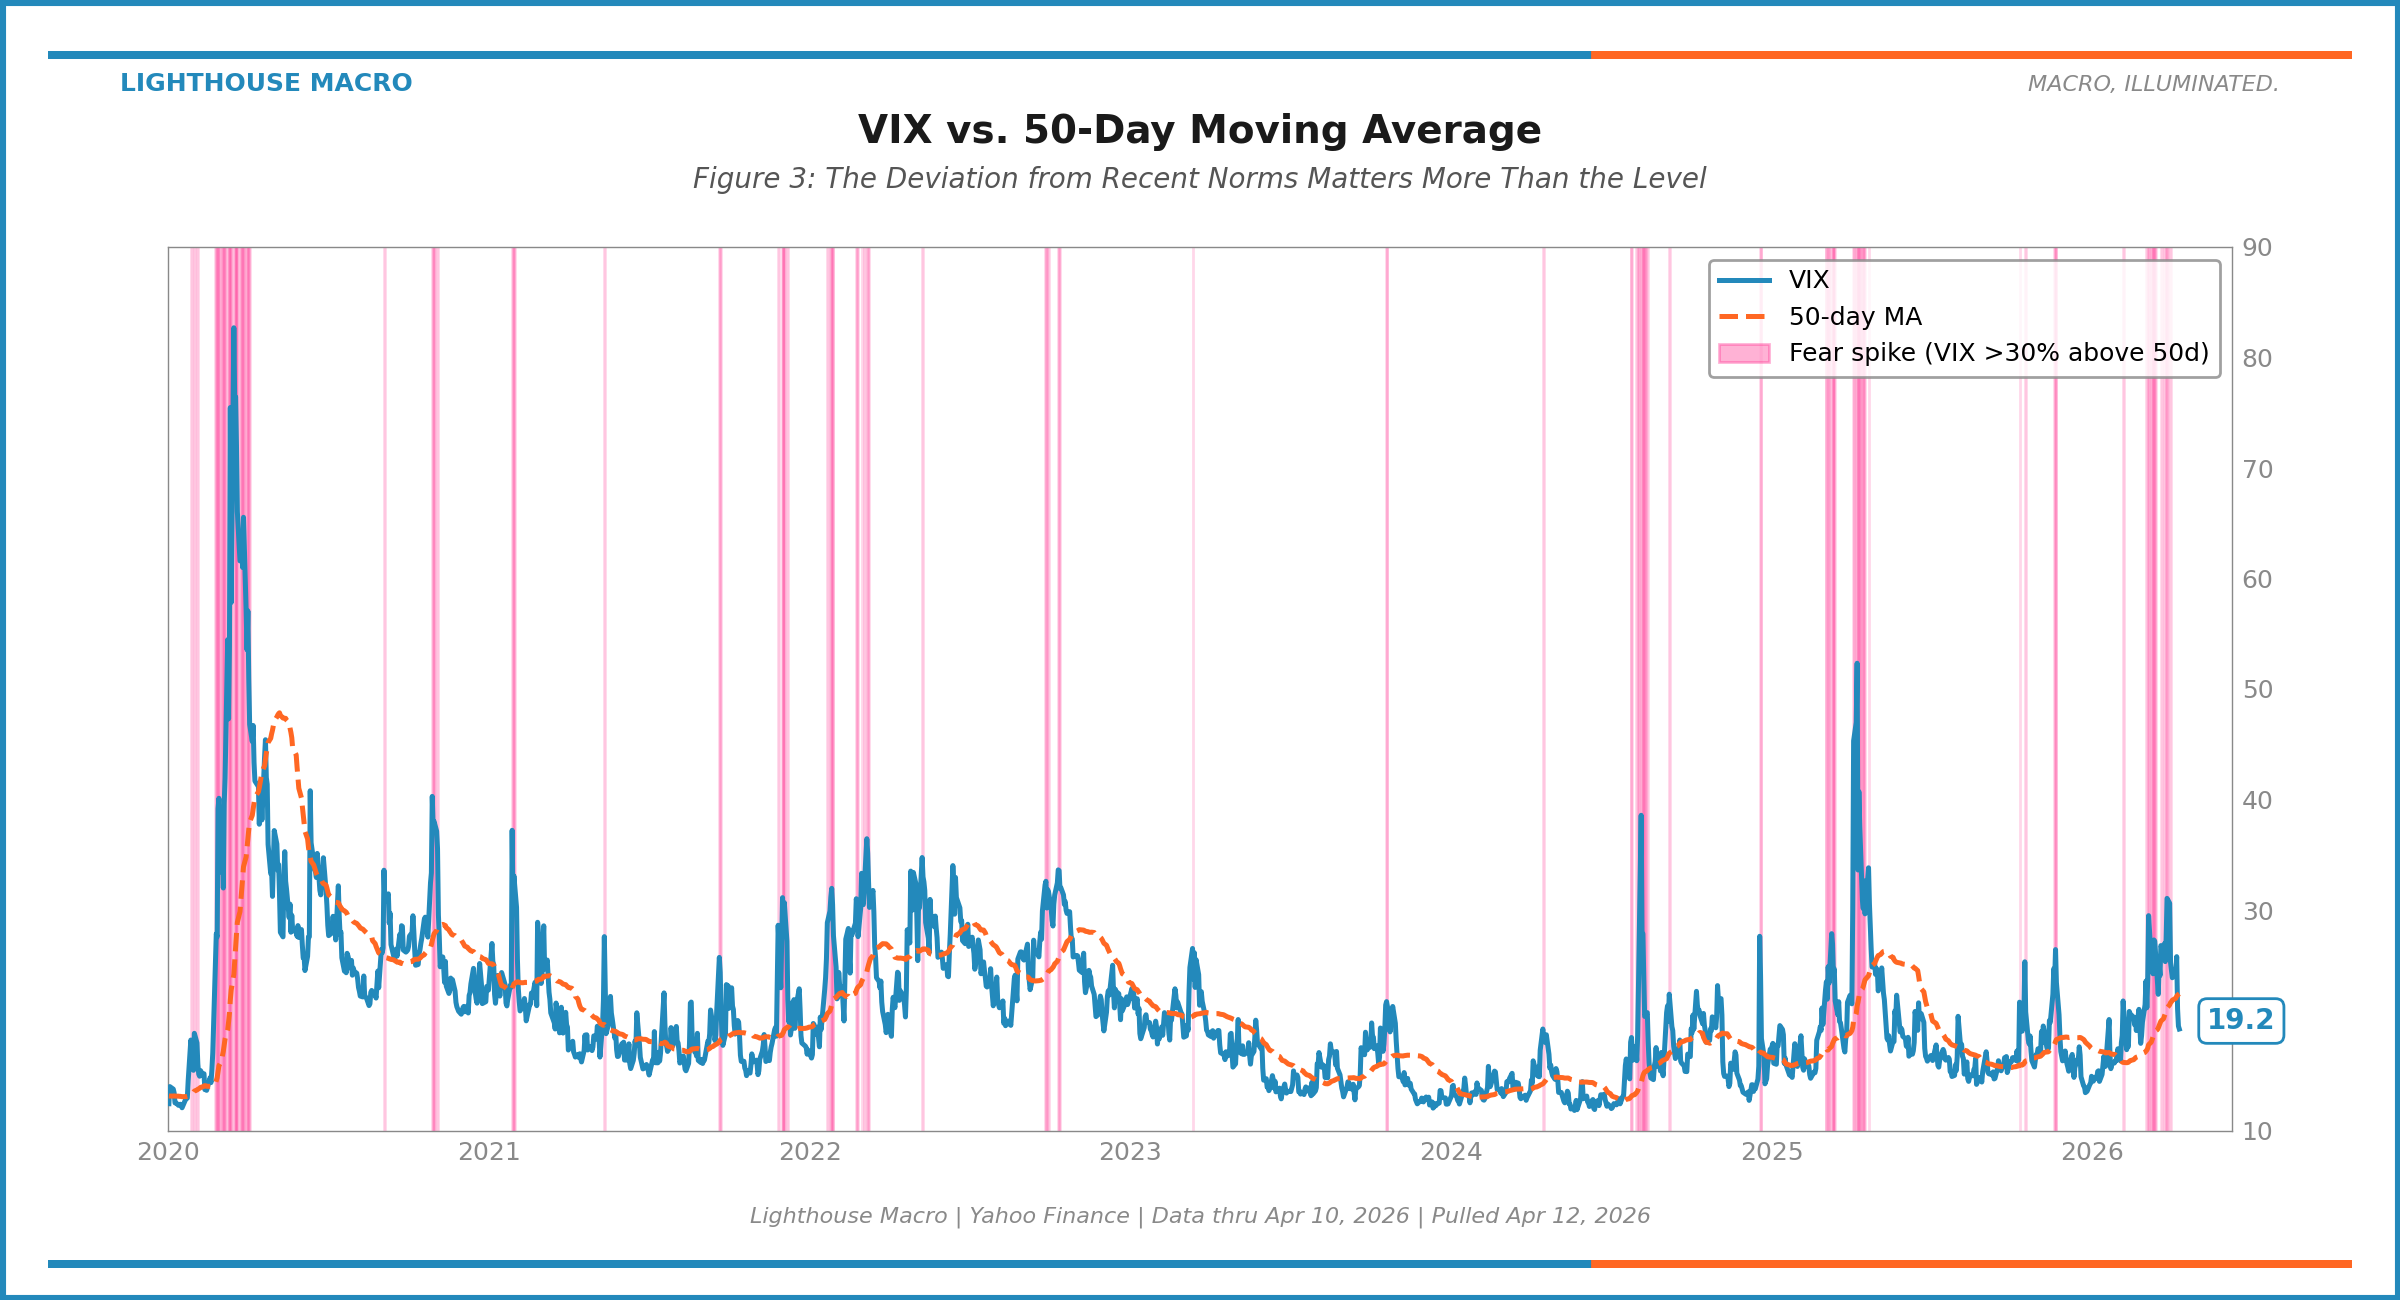
As of April 10, the VIX sits at 19.2, approximately 14% below its 50-day moving average. The March fear spike resolved hard: VIX compressed from the mid-20s into the high teens as the tariff escalation de-escalated and breadth repaired. What was “elevated fear” a month ago is now “quiet complacency.” The 50-day MA is still elevated (around 22.4) because it’s dragging the March spike through its calculation window, but spot VIX has moved well ahead of it.
This is the opposite regime from where we started. A VIX 14% below its 50-day is inside the complacency zone on our framework. Not at the -20% extreme, but trending there. And it matters that retail is still bearish while vol has compressed, that’s the divergence worth watching.
VIX Term Structure: The Stress Detector
The VIX term structure adds a dimension that the spot VIX alone misses. Normally, longer-dated volatility is higher than near-term volatility. That’s contango. It reflects the simple fact that more can go wrong over 90 days than over 30. When the curve inverts, when near-term VIX exceeds VIX3M (3-month implied vol), the market is in backwardation.
Backwardation is rare and significant. It means hedging demand for the next 30 days is so intense that it exceeds demand for 90-day protection. Institutions aren’t buying portfolio insurance for the year. They’re scrambling to cover the next month. That’s panic behavior.
Historically, VIX backwardation events cluster around major market bottoms: March 2020, October 2022, the August 2024 unwind. They’re short-lived (typically resolving within 1-3 weeks) because the acute stress either materializes into a broader crisis or gets resolved. The resolution, in both cases, tends to favor the buyer. When backwardation appears alongside extreme AAII bearish readings and washed breadth, you have a multi-dimensional capitulation signal.

The chart makes the rarity visible. Backwardation events appear as brief spikes above the 1.0 line, usually lasting days to a few weeks. The current ratio is 0.88, deep contango. Institutions are paying far more for 90-day protection than 30-day protection, which means they see near-term risk as resolved and are hedging longer-dated tail risk. No acute stress. The fire alarm is off.
AAII Bears vs. S&P 500: Fear Creates Opportunity
The best test of a sentiment framework is whether it correctly identifies when fear creates opportunity. Overlay the AAII bearish percentage against the S&P 500, and the pattern is stark: spikes in bearish sentiment align with equity troughs.
Our threshold for extreme bearish readings is 50%. When more than half of surveyed retail investors are bearish, the capitulation is typically near-complete. This happened during the COVID crash (bears spiked above 50%), during the 2022 bear market (persistent readings in the 50-60% range), and during the tariff selloffs of early 2025.

The mechanism is mechanical, not mystical. When 50%+ of surveyed investors are bearish, they’ve expressed that view through their portfolios. They’ve reduced equity exposure, rotated to cash or bonds, and are psychologically prepared for lower prices. But because they’ve already acted, they’ve removed themselves as sellers. The selling pressure is spent. Any positive catalyst, a better-than-expected earnings report, a policy shift, even just the passage of time without further deterioration, brings buying back from a depleted seller pool.
Current reading: bears at 43.0%, and the prior three weeks printed 51.4%, 49.8%, and 52.0%. That’s a month of bears clustered around the 50% threshold, right at the line where capitulation typically becomes a contrarian signal. Combined with the VIX collapse, it’s the kind of divergence that historically resolves with retail converging upward toward the tape.
VIX Deviation from 50-Day MA: Daily Regime Detection
While AAII is weekly, the VIX deviation provides a daily sentiment read. This is the same concept as Figure 3 but focused on regime classification rather than the raw VIX level.
Above +30%: fear spike. The VIX has lurched above its recent average by a standard-deviation-plus move. These events typically resolve within 1-2 weeks, either by VIX declining (fear abating) or the 50-day MA rising to meet it (elevated fear becoming the new normal).
Below -20%: complacency. The VIX is suppressed well below its recent average. The crowd has collectively decided that risk is low and hedging is unnecessary. These periods feel comfortable but breed vulnerability. A VIX at 12 with the 50-day at 15 means implied vol has been compressed below where even recent history says it should be. The next shock will feel worse because nobody prepared for it.

The shaded zones make the regime transitions visible. Fear spikes (red shading above +30%) tend to cluster and resolve quickly. Complacency zones (green shading below -20%) tend to persist longer but end abruptly. The asymmetry makes sense: fear spikes because catalysts are sudden, but complacency builds gradually as risk gets repriced lower over weeks and months.
Money Market Fund Assets: The Cash Mountain
Money market fund assets represent the single largest pool of cash on the sidelines. At roughly $8.4 trillion, this is a record. More capital is parked in money markets than at any point in history.
The absolute level matters, but the year-over-year change is the sharper signal. Rapidly rising MMF assets indicate panic accumulation: investors fleeing equities for the safety of T-bills and repo. The rate of accumulation tells you how fast fear is building. Falling MMF assets indicate rotation back into risk. Cash is leaving the sidelines and re-entering equities, credit, or other risk assets.
The dual-purpose nature of the cash mountain is critical to understand. Record cash is simultaneously a fear indicator (investors fled) and a bullish catalyst (that cash is future buying power). When the rotation begins, trillions of sidelined capital represent enormous demand. The question is always: what triggers the rotation?

Look at the COVID pattern. MMF assets spiked in March-April 2020 as investors panicked into cash. Within months, that cash rotated back into equities, fueling one of the strongest rallies in market history. The cash mountain was both the evidence of fear and the fuel for the recovery. The same dynamic played out after 2022: elevated MMF assets through mid-2023 preceded the broad equity rally into 2024.
Currently, the YoY growth rate has stabilized. Assets are near record highs but the rate of new accumulation has slowed. This is consistent with a market that’s cautious but not panicking. The cash is there. The trigger for rotation hasn’t arrived yet.
The Composite: SPI in Action
The SPI brings all four dimensions together. Here’s how it looks overlaid against the S&P 500 over the past two decades.

The long-term view reveals the SPI’s track record at extremes. The COVID crash (March 2020) pushed the SPI above +2.0, one of the strongest contrarian buy signals in the series. The post-vaccine euphoria of late 2020 and early 2021 drove it below -1.0. The 2022 bear market generated sustained readings above +1.0, with spikes above +1.5 marking the October bottom. Each extreme preceded the expected move.
But here’s what the chart also shows: the SPI spends most of its time between -0.5 and +0.5. That’s the “no edge” zone. During these periods, sentiment is balanced and provides no directional guidance. This is by design. Sentiment is a contrarian tool. It only works at extremes. Trying to extract signal from neutral readings is a recipe for whipsaws.
SPI Zoomed: Recent Regimes

The zoomed view shows the SPI’s behavior during a period that included the 2023 banking stress, the late 2023 rally, the 2024 AI euphoria, and the 2025-2026 tariff volatility. Several observations stand out:
The raw SPI (Sky line) is noisy. Daily fluctuations driven by put/call ratio swings and VIX movements create a jagged signal. The 10-day smoothed version (Ocean) captures the regime without the noise. We use the smoothed version for decision-making and the raw version for early detection.
The SPI touched the +1.0 zone during the March 2026 tariff selloff, suggesting elevated fear but not extreme capitulation. It has since flipped negative as the ceasefire rally compressed the VIX into deep contango and breadth repaired. The current proxy read sits around -0.3: mild complacency, not euphoria, but trending the wrong way if the vol compression continues.
The Divergence Indicator: Sentiment-Structure Divergence (SSD)
The SSD is where Pillar 12 meets Pillar 11. It measures the alignment between how the crowd feels and how the market actually looks structurally. The formula is deliberately simple:
SSD = z(SPI) + z(MSI)
The logic: when both sentiment and structure point the same direction, the signals reinforce each other. When they diverge, something interesting is happening.
SSD > +1.5 (Capitulation Low): The crowd has capitulated (high SPI = fear) while market structure is simultaneously weak. Fear plus broken structure. This is the classic bottom formation. March 2020 and October 2022 were textbook SSD capitulation events.
SSD < -1.5 (Blow-Off Top): The crowd is euphoric (low SPI = greed) while market structure is strong. Euphoria plus strong structure. This sounds bullish, but it’s actually the setup for a correction. Late 2021 before the 2022 bear market was a classic SSD blow-off reading.

The current SSD proxy reads near -0.5: neutral, but trending toward complacency risk. A month ago the reading was -1.28, driven entirely by broken structure while sentiment was neutral. Today structure has healed and sentiment has tilted mildly complacent. The signal has flipped from “structure broken while crowd unconcerned” to “structure healed while vol priced to perfection and retail stuck bearish.” It’s not a warning yet. But it’s the shape of one.
Integration: Sentiment Sizes the Trade
This is the point that separates a sentiment framework from sentiment trading. We do not trade sentiment. We use sentiment to size and time trades identified by fundamentals and structure.
The hierarchy is explicit:
Fundamentals (Pillars 1-7): Determine direction. Is the economy expanding or contracting? Are labor flows healthy? Is credit stress rising?
Monetary (Pillars 8-10): Sets the regime. Is fiscal dominance in play? Are credit conditions tightening? Is the plumbing absorbing shocks or transmitting them?
Structure (Pillar 11): Confirms or denies. Is the market’s internal health consistent with the fundamental picture? Is breadth expanding or contracting?
Sentiment (Pillar 12): Sizes and times. Given the fundamental direction and structural confirmation, how aggressively should we position, and is the timing favorable?

The full setup, bullish fundamentals with structural confirmation and elevated fear, is the highest-conviction entry in the entire framework. It means the economy is healthy, the market’s internals agree, and the crowd has gotten scared for reasons that haven’t changed the fundamental picture. That’s when you press. It’s rare, and it should be.
The counter-trend tactical exhaustion trade is the opposite extreme: fundamentals are bearish, structure is broken, but fear has reached levels that historically mark at least a tradeable bounce. These are short-duration, smaller-size trades. The SPI must be above +1.0 for this trade to qualify, and it requires explicit confirmation from Pillar 11’s tactical exhaustion criteria.
The Consensus Trap
The consensus trap in sentiment analysis is the “VIX is elevated so the market must be about to crash” narrative. Or its mirror: “VIX is low so everything is fine.”
Both are wrong, and they’re wrong for the same reason. They confuse the sentiment reading with a directional forecast. The VIX at 25 doesn’t mean the market is going down. It means fear is elevated. Elevated fear, by itself, is actually a mildly bullish signal because it means the crowd has already hedged. The risk isn’t priced in for the first time. It’s already in the price.
The deeper version of this trap is treating sentiment as a standalone signal. “AAII bears are above 40%, buy the dip.” That’s cargo-cult contrarianism. Without checking fundamentals and structure first, you’re just fading the crowd on faith. Sometimes the crowd is bearish because things are actually getting worse, and the selling has further to go. October 2008 saw extreme bearish readings. The market fell another 25% before bottoming in March 2009.
The framework guards against this by requiring multi-pillar confirmation. Sentiment at extremes gets your attention. Fundamentals and structure tell you whether to act. The crowd can be early, and you don’t want to catch a falling knife just because retail investors are scared.
Where We Are Now
As of the latest available data (AAII week ending Apr 8, market data thru Apr 10):

SPI ≈ -0.3 (Mild complacency). The composite has flipped since the March snapshot. The VIX component is pulling it down hard (-14% deviation from 50d, deep contango in term structure). The AAII component is pulling it up (bears at 43%, spread -7.3%, persistent for four weeks). The vol side is winning. Options markets don’t see risk. Retail does. History says the options markets usually resolve the disagreement.
SSD ≈ -0.5 (Neutral, trending toward complacency risk). Structure has healed (SPX +2.3% vs 200d, 54% of stocks above 200d, breadth repaired), and sentiment has shifted from fear to mild complacency. This isn’t the “broken structure + neutral sentiment” configuration we saw a month ago. It’s closer to the textbook pre-complacency setup: fear fading, structure healing, retail slow to adjust.
The honest read: The regime flipped. A month ago sentiment was neutral and structure was broken; today structure is healed and sentiment is tilting complacent while retail remains stuck-bearish. The contrarian edge has shifted, not to “buy the fear” (the fear is gone), but to “watch the retail-vol divergence.” When retail bearishness has persisted this long while implied vol compresses, the tape usually resolves by either (a) AAII bears capitulating upward as the rally pulls them in, or (b) a vol spike that vindicates the pessimists. The fast indicators are betting on (a). We’d agree, with the caveat that -20% VIX deviation is the line where complacency becomes its own warning signal.
How to Track
You don’t need a Bloomberg terminal to monitor sentiment:
AAII Survey: Published every Thursday at aaii.com/sentimentsurvey. Free. The bull-bear spread is the headline number. Check it weekly.
VIX: Real-time on any platform. Search ^VIX on Yahoo Finance, TradingView, or Google. For the 50-day MA, overlay a 50-period SMA on a daily chart.
VIX3M (Term Structure): Search ^VIX3M on Yahoo Finance or TradingView. Divide VIX by VIX3M. Above 1.0 = backwardation.
NAAIM: Published every Wednesday at naaim.org. Free. Watch the mean exposure number.
Put/Call Ratio: CBOE publishes daily. Search “CBOE equity put/call ratio” or use $PCCE on StockCharts. Apply a 10-day SMA.
Money Market Fund Assets: ICI publishes weekly at ici.org. The Fed H.6 release also tracks this monthly.
CNN Fear & Greed Index: Real-time composite at CNN.com. Good for a quick gut-check, not precise enough for systematic use.
The real edge isn’t access. It’s discipline. Check weekly. Build a routine. Note the extremes. Ignore the middle. And always, always cross-reference with structure before acting.
Invalidation Criteria
What would invalidate a bullish contrarian signal (when SPI > +1.5):
Extreme fear readings that persist for 6+ months without mean-reverting, suggesting a structural regime shift rather than a positioning extreme
Sentiment wash-out combined with accelerating fundamental deterioration across Pillars 1-7 (labor deteriorating, credit widening, growth contracting simultaneously)
Credit markets confirming the fear: HY OAS widening above 600 bps, CLG deeply negative, suggesting spreads are reacting to real fundamental stress rather than just positioning
Earnings revisions turning sharply negative while sentiment is already bearish, meaning the crowd may be early rather than wrong
What would invalidate a bearish contrarian signal (when SPI < -1.0):
Euphoria that persists alongside improving breadth and fundamental acceleration, suggesting a secular bull market rather than a blow-off
Central bank intervention that expands liquidity faster than positioning can unwind, overriding the natural mean-reversion of sentiment
Earnings growth re-accelerating despite euphoric positioning, meaning the fundamentals are validating the crowd’s optimism
New structural innovation (AI capex cycle, energy transition) that durably shifts the earnings trajectory, making prior valuations look reasonable in hindsight
Both sides have explicit conditions. If you can’t state what would prove you wrong, you don’t have a framework. You have a conviction.
Bottom Line
Sentiment is the contrarian edge. It doesn’t tell you what to do. It tells you how much and when. The crowd is a lagging indicator. By the time they’re bullish, they’ve bought. By the time they’re bearish, they’ve sold. Your edge is knowing who’s left.
Right now, retail is still leaning bearish after a month of elevated readings while the VIX has collapsed and structure has healed. That’s not a full contrarian extreme, AAII bears haven’t touched 50% this week, the spread hasn’t cracked -20%, but it’s the kind of persistent divergence that usually resolves with the slow indicators (retail surveys) converging toward the fast indicators (options markets, breadth). The options tape is saying “risk is resolved.” The retail tape is saying “I don’t believe you.”
What changes the call? AAII bears rolling back under 35% confirms the retail capitulation. VIX pushing back above its 50-day would re-arm the fear signal. SPI above +1.5 would fire a real contrarian buy. On the other side: VIX deviation below -20% plus AAII bulls above +30% would flash the blow-off warning. Until then, Pillar 12 says the risk/reward tilts mildly constructive, with complacency the growing risk on the horizon.
Twelve pillars. Three engines. One framework.
That’s how we read the macro from The Watch.
This is Pillar 12 of the Diagnostic Dozen, the final installment of a 12-part series breaking down the macro framework that powers everything we do at Lighthouse Macro. The series is now complete.
Bob Sheehan, CFA, CMT | Founder & Chief Investment Officer
Lighthouse Macro | Research | @LHMacro
excellent