

Plumbing: The Invisible Infrastructure
Diagnostic Dozen, Pillar 10 of 12

On September 17, 2019, something broke.
Not in the economy. Not in the stock market. In the pipes underneath them. The overnight repo rate, a number that most people have never heard of and fewer still could define, spiked from 2.43% to a published benchmark of 5.25%, with intraday transactions printing as high as 10%. Banks that normally lend to each other without a second thought suddenly couldn’t. Or wouldn’t. The Fed, which had spent a decade assuring everyone that the financial system was resilient, had to intervene with emergency liquidity injections the same morning.
No recession preceded it. No financial crisis followed. But the plumbing of the US financial system had, for a brief and terrifying moment, seized up. And the people closest to it didn’t see it coming.
That episode is the reason this pillar exists. Because the plumbing of the financial system, the network of reserves, repo markets, and funding spreads that keeps everything moving, is invisible until it isn’t. And by the time it becomes visible, you’re already in the emergency room.
The Core Insight
Here’s the simplest version of the plumbing story: the Federal Reserve creates money (reserves). Banks hold those reserves. Other financial institutions (money market funds, dealers, hedge funds) borrow and lend those reserves overnight through the repo market. The Treasury’s checking account at the Fed (the TGA) absorbs and releases reserves depending on whether the government is collecting taxes or spending money. And the Fed’s Reverse Repo Facility (RRP) acts as a parking lot for excess cash.
When reserves are plentiful, funding markets are calm. Spreads are tight. Nobody worries. When reserves get scarce, or unevenly distributed, the calm breaks. Fast.
But there’s a layer beneath this that most macro commentary ignores: the dealers who intermediate this system are structurally constrained. Under Basel III leverage ratio rules (the Supplementary Leverage Ratio, or SLR), every dollar a bank lends in the repo market expands its balance sheet and requires capital to back it. That makes repo lending expensive. It’s why, in the current regime, the secured overnight rate (SOFR) can trade above the unsecured rate (EFFR), which is the opposite of what textbook finance predicts. Lending against Treasury collateral should be cheaper than lending unsecured. But when balance sheet capacity is the scarce resource, not credit risk, the hierarchy inverts.
This matters because the plumbing doesn’t just need reserves. It needs dealers willing to intermediate those reserves. And the regulatory architecture is taxing that willingness at exactly the moment when Treasury issuance is flooding the system with more paper to intermediate.
The critical insight for today: the buffer is gone. The RRP facility, which peaked at roughly $2.5 trillion in late 2022, has been drained to zero. Not low. Not compressed. Gone. By early January 2026, the ON RRP balance had fallen to roughly $6 billion, effectively zero in the context of a multi-trillion-dollar system. A brief year-end spike to $106 billion on December 31 collapsed within days, confirming the facility’s exhaustion. That $2.5 trillion was a shock absorber. It meant the system had a massive cushion of excess liquidity that could be redirected wherever it was needed. That cushion no longer exists.
The transmission chain is mechanical:
Fed Balance Sheet → Reserves → Bank Balance Sheets →
Dealer Intermediation → Repo Markets →
Money Market Rates → Financial Conditions →
Asset Prices
Every dollar of liquidity shock that would have been absorbed by RRP now hits reserves, dealer balance sheets, and funding markets directly. We saw this play out in the fall of 2025. By mid-September, SOFR had climbed to 4.42% and funding conditions remained strained into October. When Trump’s 100% China tariff announcement hit on October 10, it detonated a system that was already running without a buffer: $19.16 billion in crypto liquidations in 24 hours, a 14% single-day drawdown in Bitcoin. That wasn’t purely a crypto event and it wasn’t purely a plumbing event. It was exogenous shock meeting endogenous fragility. The plumbing was already strained, and crypto, as the most levered and most volatile asset class in the system, absorbed the damage first.
The Fed ended QT on December 1, 2025, after draining roughly $2.2 trillion in securities since June 2022. That was the right call. Reserves had declined to approximately $3.0 trillion, close enough to the estimated comfort zone that continuing the drain risked repeating September 2019. But ending QT doesn’t refill the pool. Reserves sit at $3.02 trillion, and non-reserve liabilities (currency in circulation, the TGA) continue to grow, which means reserves can still decline even without active runoff. We’ve gone from “abundant reserves” to “ample reserves,” and the distance between ample and scarce is shorter than most people assume.
And sitting underneath this thinning reserve cushion is a structural fragility that connects directly to Pillar 8 (Government): the Treasury basis trade. Hedge funds, many domiciled offshore, hold an estimated $1.85 trillion in Treasuries, financed through overnight and short-term repo. They are, effectively, the marginal buyer of US government debt. The trade is simple: buy the cash bond, short the future, finance via repo, pocket the spread. Levered anywhere from 20x to as high as 50x or more, because the spread is tiny. It works beautifully. Until repo rates spike. When overnight funding costs explode, these funds face margin calls on the futures leg and higher financing costs on the cash leg simultaneously. The forced selling of Treasuries to meet margin calls is how plumbing stress becomes a Treasury market event. This isn’t hypothetical. It happened in March 2020. The basis blew out, and the Fed had to buy over $1 trillion in Treasuries in a matter of weeks, with combined Treasury and MBS purchases exceeding $1.6 trillion by the end of March.
What to Watch
The plumbing pillar boils down to a handful of signals. They’re not glamorous. They don’t make headlines. But they’re the earliest warnings you’ll get before funding stress becomes a market event.
Reserves vs. LCLOR. This is the anchor metric. Bank reserves minus the Fed’s comfort threshold tells you how much runway the system has. When the gap narrows, every other plumbing signal matters more.
EFFR-IORB spread. The effective federal funds rate minus the interest on reserve balances. This spread should be slightly negative (banks lend below IORB because they’re flush). When it turns positive and approaches +8 basis points, cash is getting scarce. Fast.
SOFR-IORB spread. Same concept, secured market. SOFR is the benchmark for the $4+ trillion overnight repo market. The Sep 2019 blowout started here. When this spread widens persistently, not just on quarter-end, something structural has shifted.
The SOFR-EFFR inversion. This is the single best barometer of dealer balance sheet capacity. In a normal world, secured lending (SOFR) should be cheaper than unsecured (EFFR). When SOFR trades above EFFR, it means balance sheet is more expensive than credit risk. A persistently positive SOFR-EFFR spread is the market telling you that dealer intermediation capacity, not cash, is the binding constraint.
Quarter-end dynamics. Banks pull back from lending at quarter-end for regulatory reasons. G-SIB surcharge calculations, leverage ratio reporting, and balance sheet “window dressing” all incentivize banks to shrink their repo books on the last day of each quarter. Some shift to off-balance-sheet alternatives like FX swaps and cross-currency basis swaps to avoid the capital hit. The result is predictable: funding spreads widen mechanically every March, June, September, and December. That’s normal. What’s not normal is when those spreads widen on a random Tuesday in the middle of the quarter. The former is plumbing friction. The latter is scarce reserves.
The Indicators
1. Reserves vs. LCLOR: The Runway
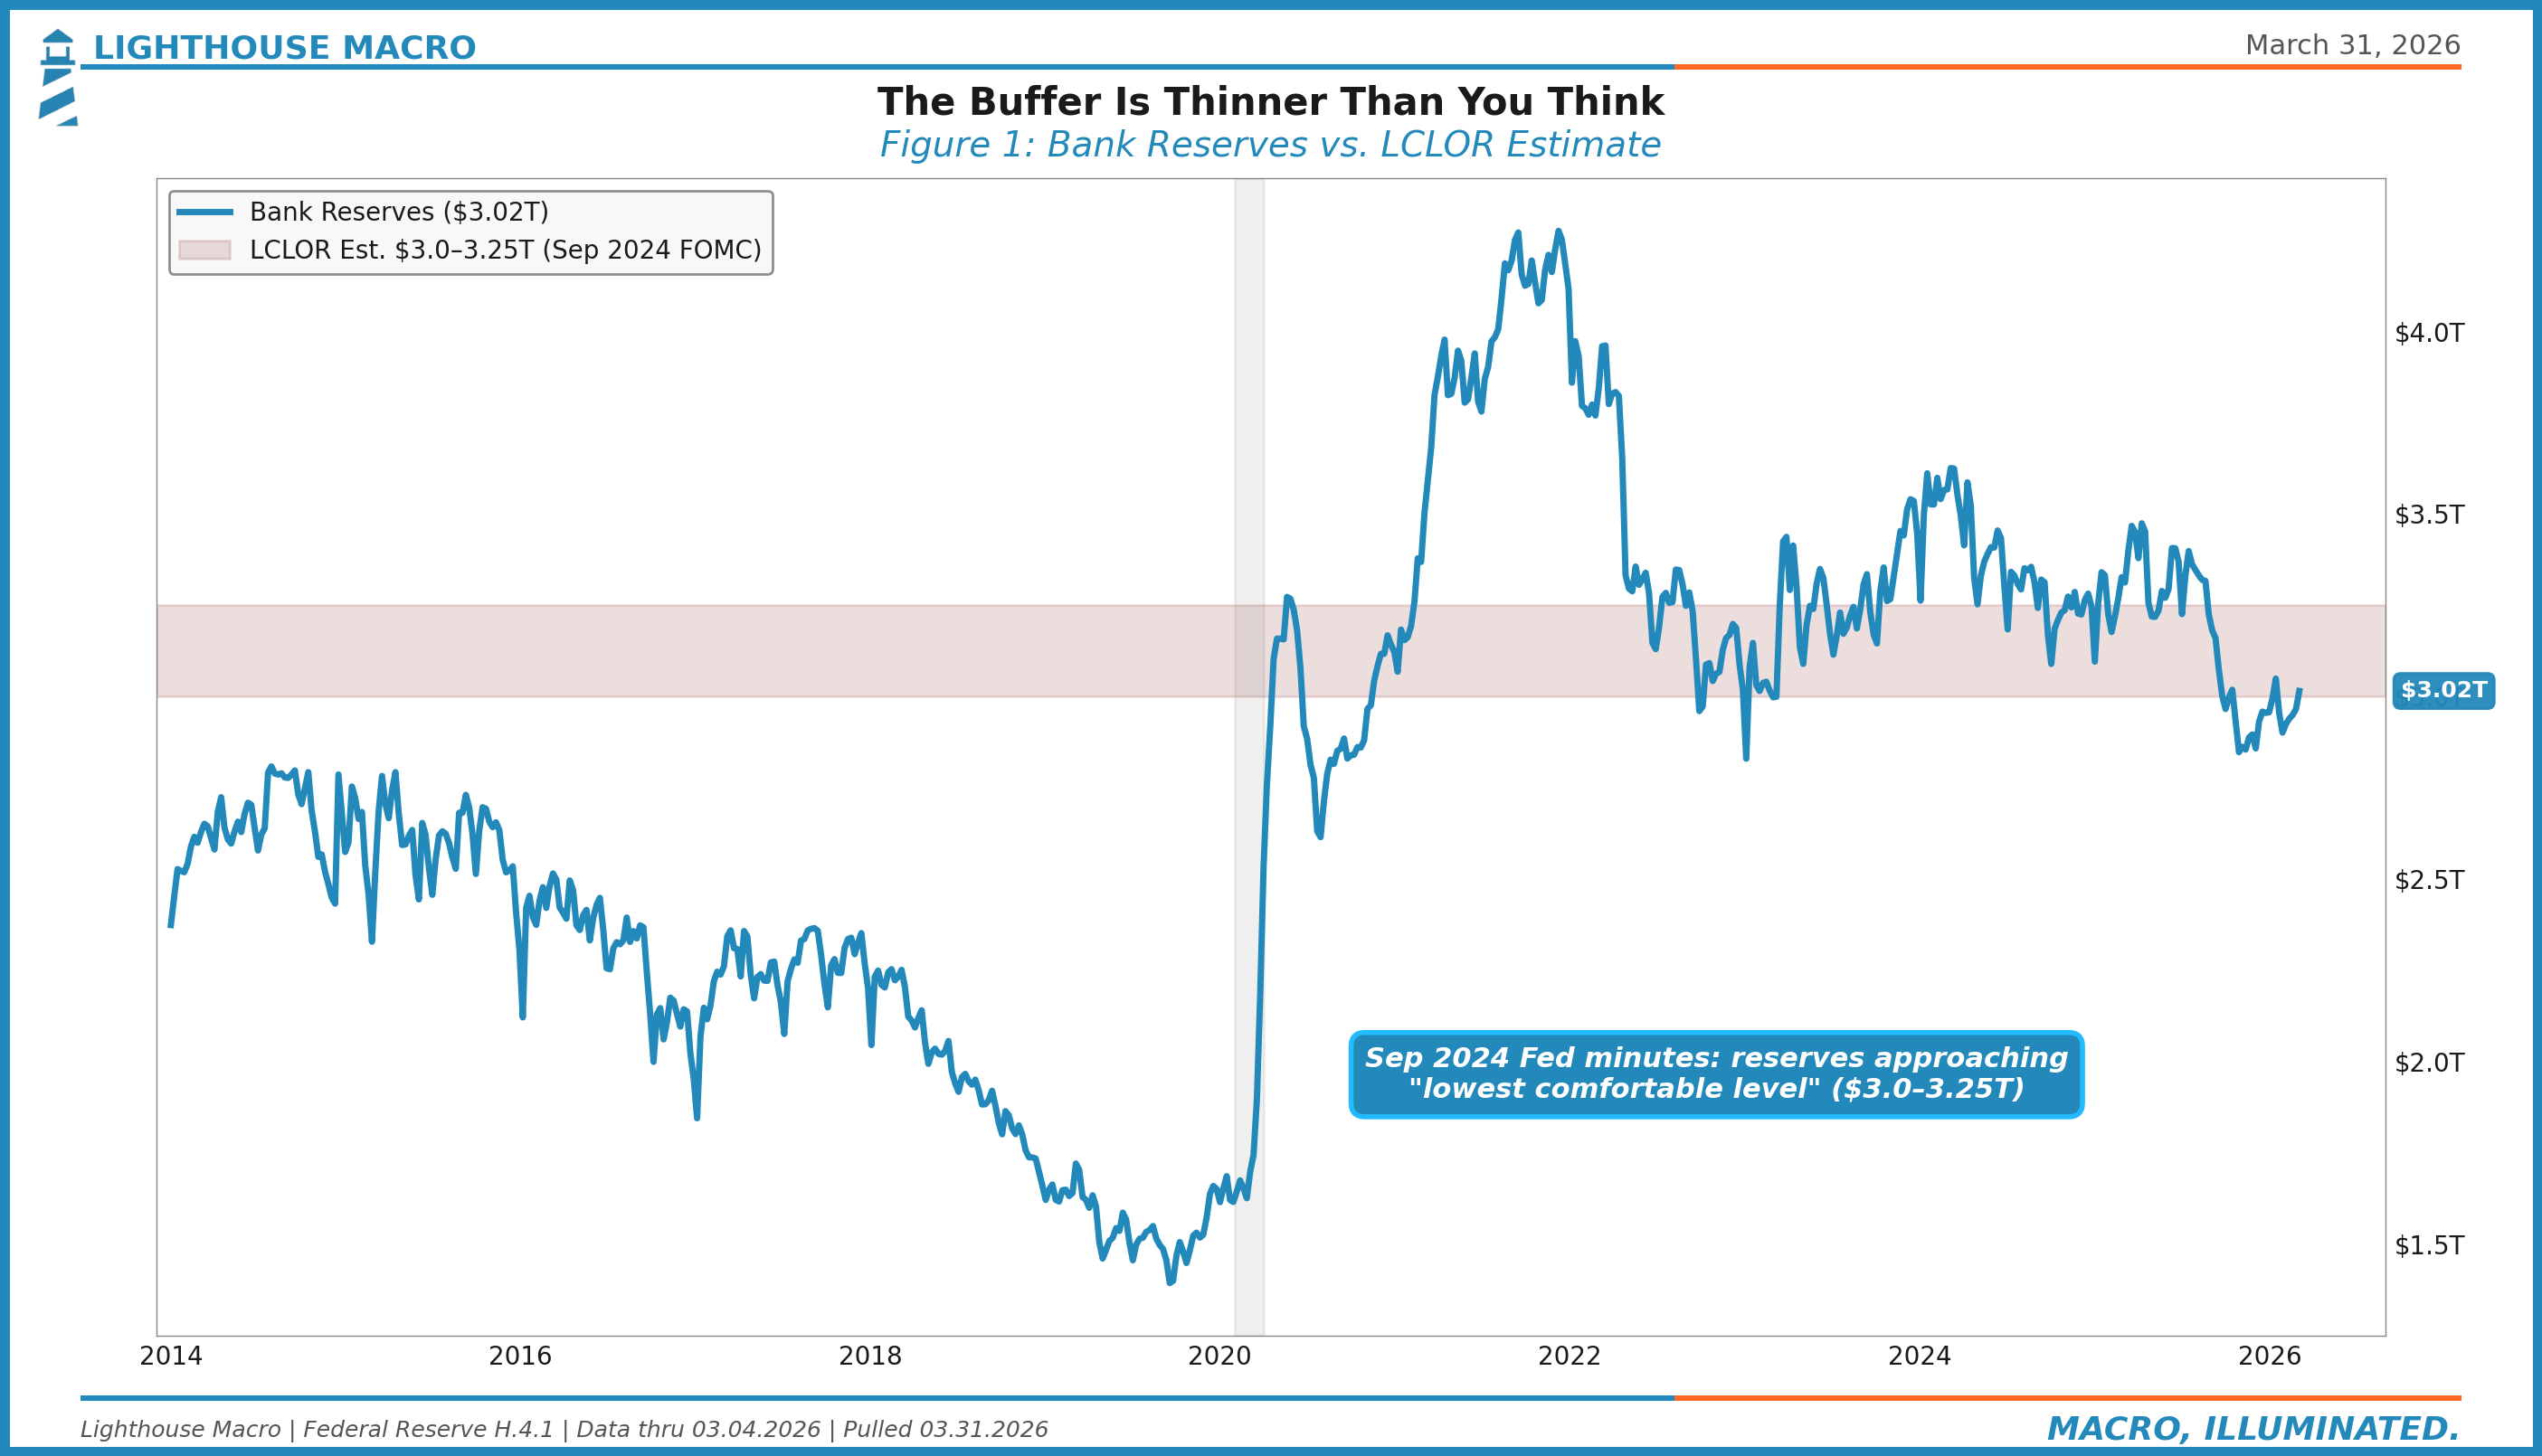
The Federal Reserve’s balance sheet mechanics determine how many reserves exist in the banking system. Quantitative easing creates reserves. Quantitative tightening destroys them. It’s that simple.
What’s less simple is knowing how many reserves are “enough.” The Fed’s own framework uses the LCLOR concept, essentially the level below which banks start hoarding cash rather than lending it. Most estimates place the range between $2.8 and $3.25 trillion, depending on methodology. Current reserves sit at $3.02 trillion, which means the margin for error is thin.
The distribution matters as much as the level. Reserves are concentrated at the largest banks. Smaller institutions and foreign banks operating in the US often face tighter conditions than the aggregate number suggests. This was precisely the dynamic that caused Sep 2019. Total reserves looked fine. But the banks that needed them didn’t have them.
The Fed ended QT in December 2025, having slowed the pace earlier in 2024 and again in early 2025. That decision removed the mechanical drain on reserves. But reserves can still decline as non-reserve liabilities grow (currency in circulation, TGA rebuilds). The question has shifted from “when does QT push us into scarcity?” to “are reserves distributed well enough to prevent localized stress even at current levels?” That’s the question that matters now. Not the aggregate, but the distribution.
2. The Reverse Repo Facility: A Spent Story
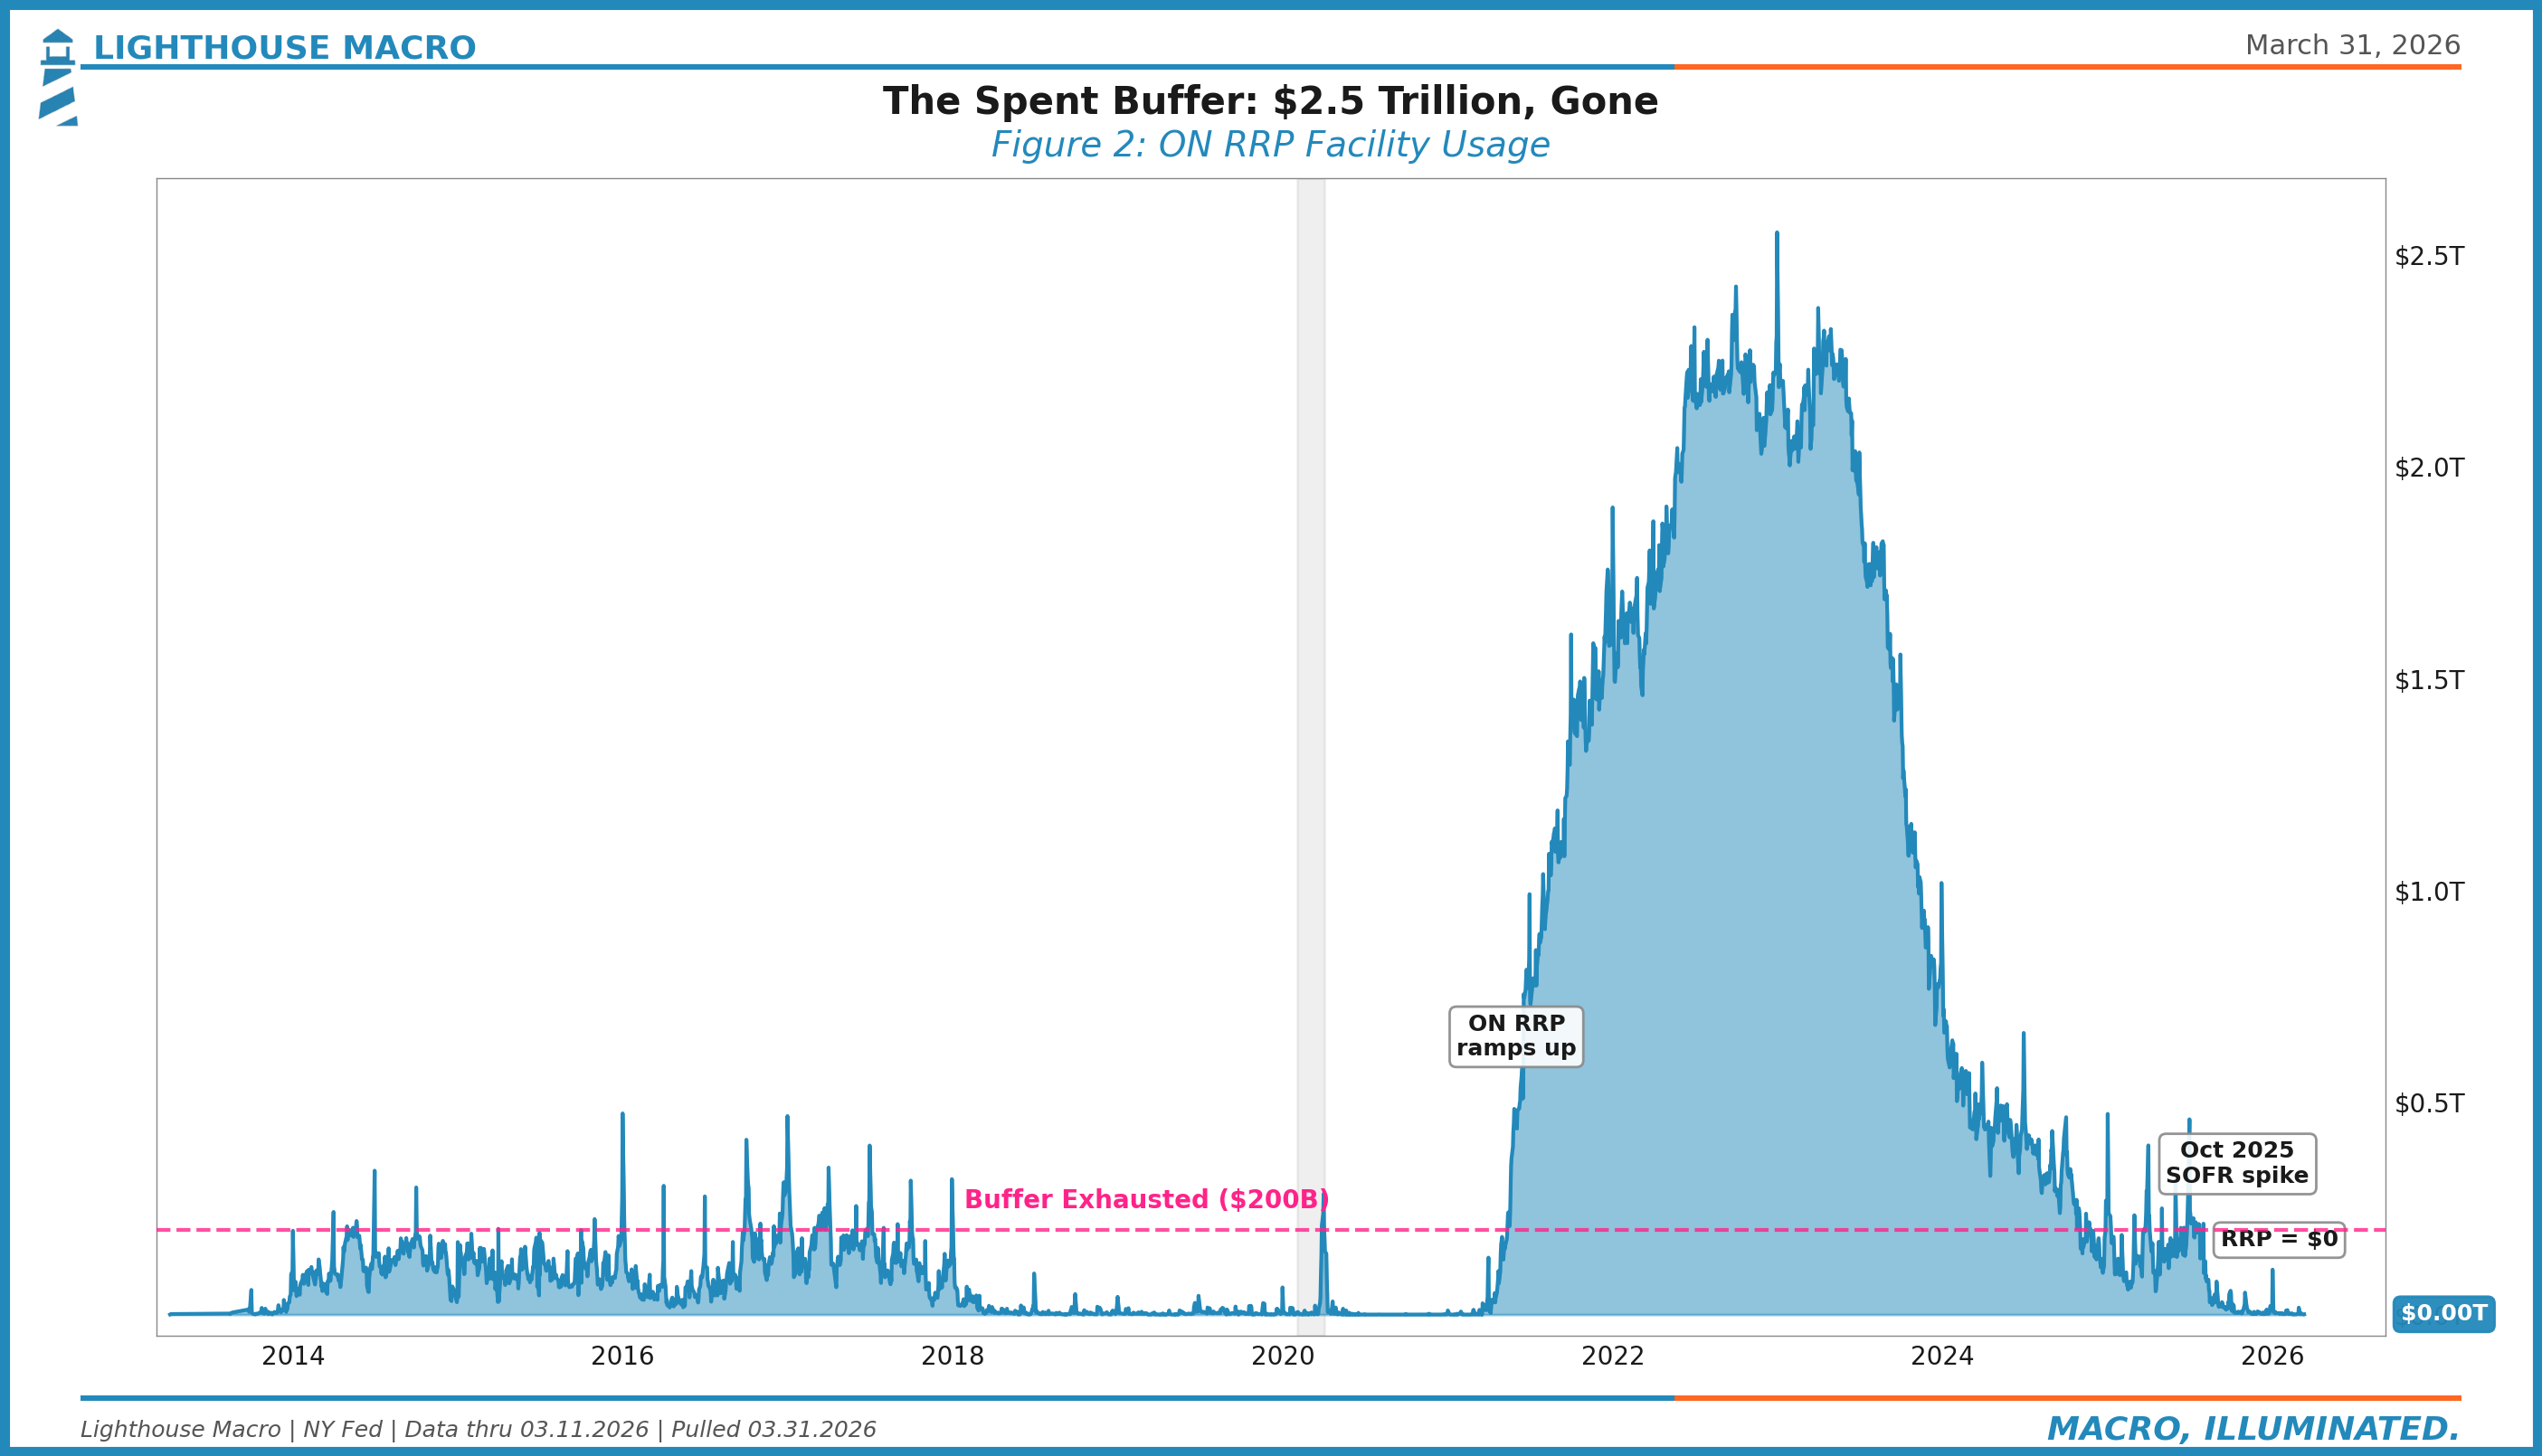
The ON RRP facility deserves a proper eulogy. Between mid-2021 and late 2022, money market funds parked over $2 trillion at the Fed overnight. It was the clearest sign of excess liquidity in the system. Cash had nowhere better to go.
Then QT started, Treasury issuance accelerated, and the RRP drained. Steadily. Predictably. And now it’s at zero.
Why does this matter? Because the RRP served as a release valve. When reserves were getting tight somewhere in the system, the cash sitting in RRP could migrate back into the banking system through T-bill purchases and money market reallocation. That migration is complete. There’s no more valve to release.
We saw the consequences in the fall of 2025. RRP was already near zero when funding conditions tightened in September and the October tariff shock hit. The stress cascaded through crypto leverage (the most fragile link), triggering $19.16 billion in liquidations. By February, the February crypto event was only $2.2 billion in liquidations, but it happened with zero buffer capacity. The system didn’t break harder because leverage hadn’t rebuilt. Not because the plumbing could handle it.
The practical implication: the next time reserves get squeezed, the system absorbs the shock with whatever reserves banks already hold. There’s no backstop buffer waiting to flow in.
3. EFFR-IORB: The Unsecured Canary
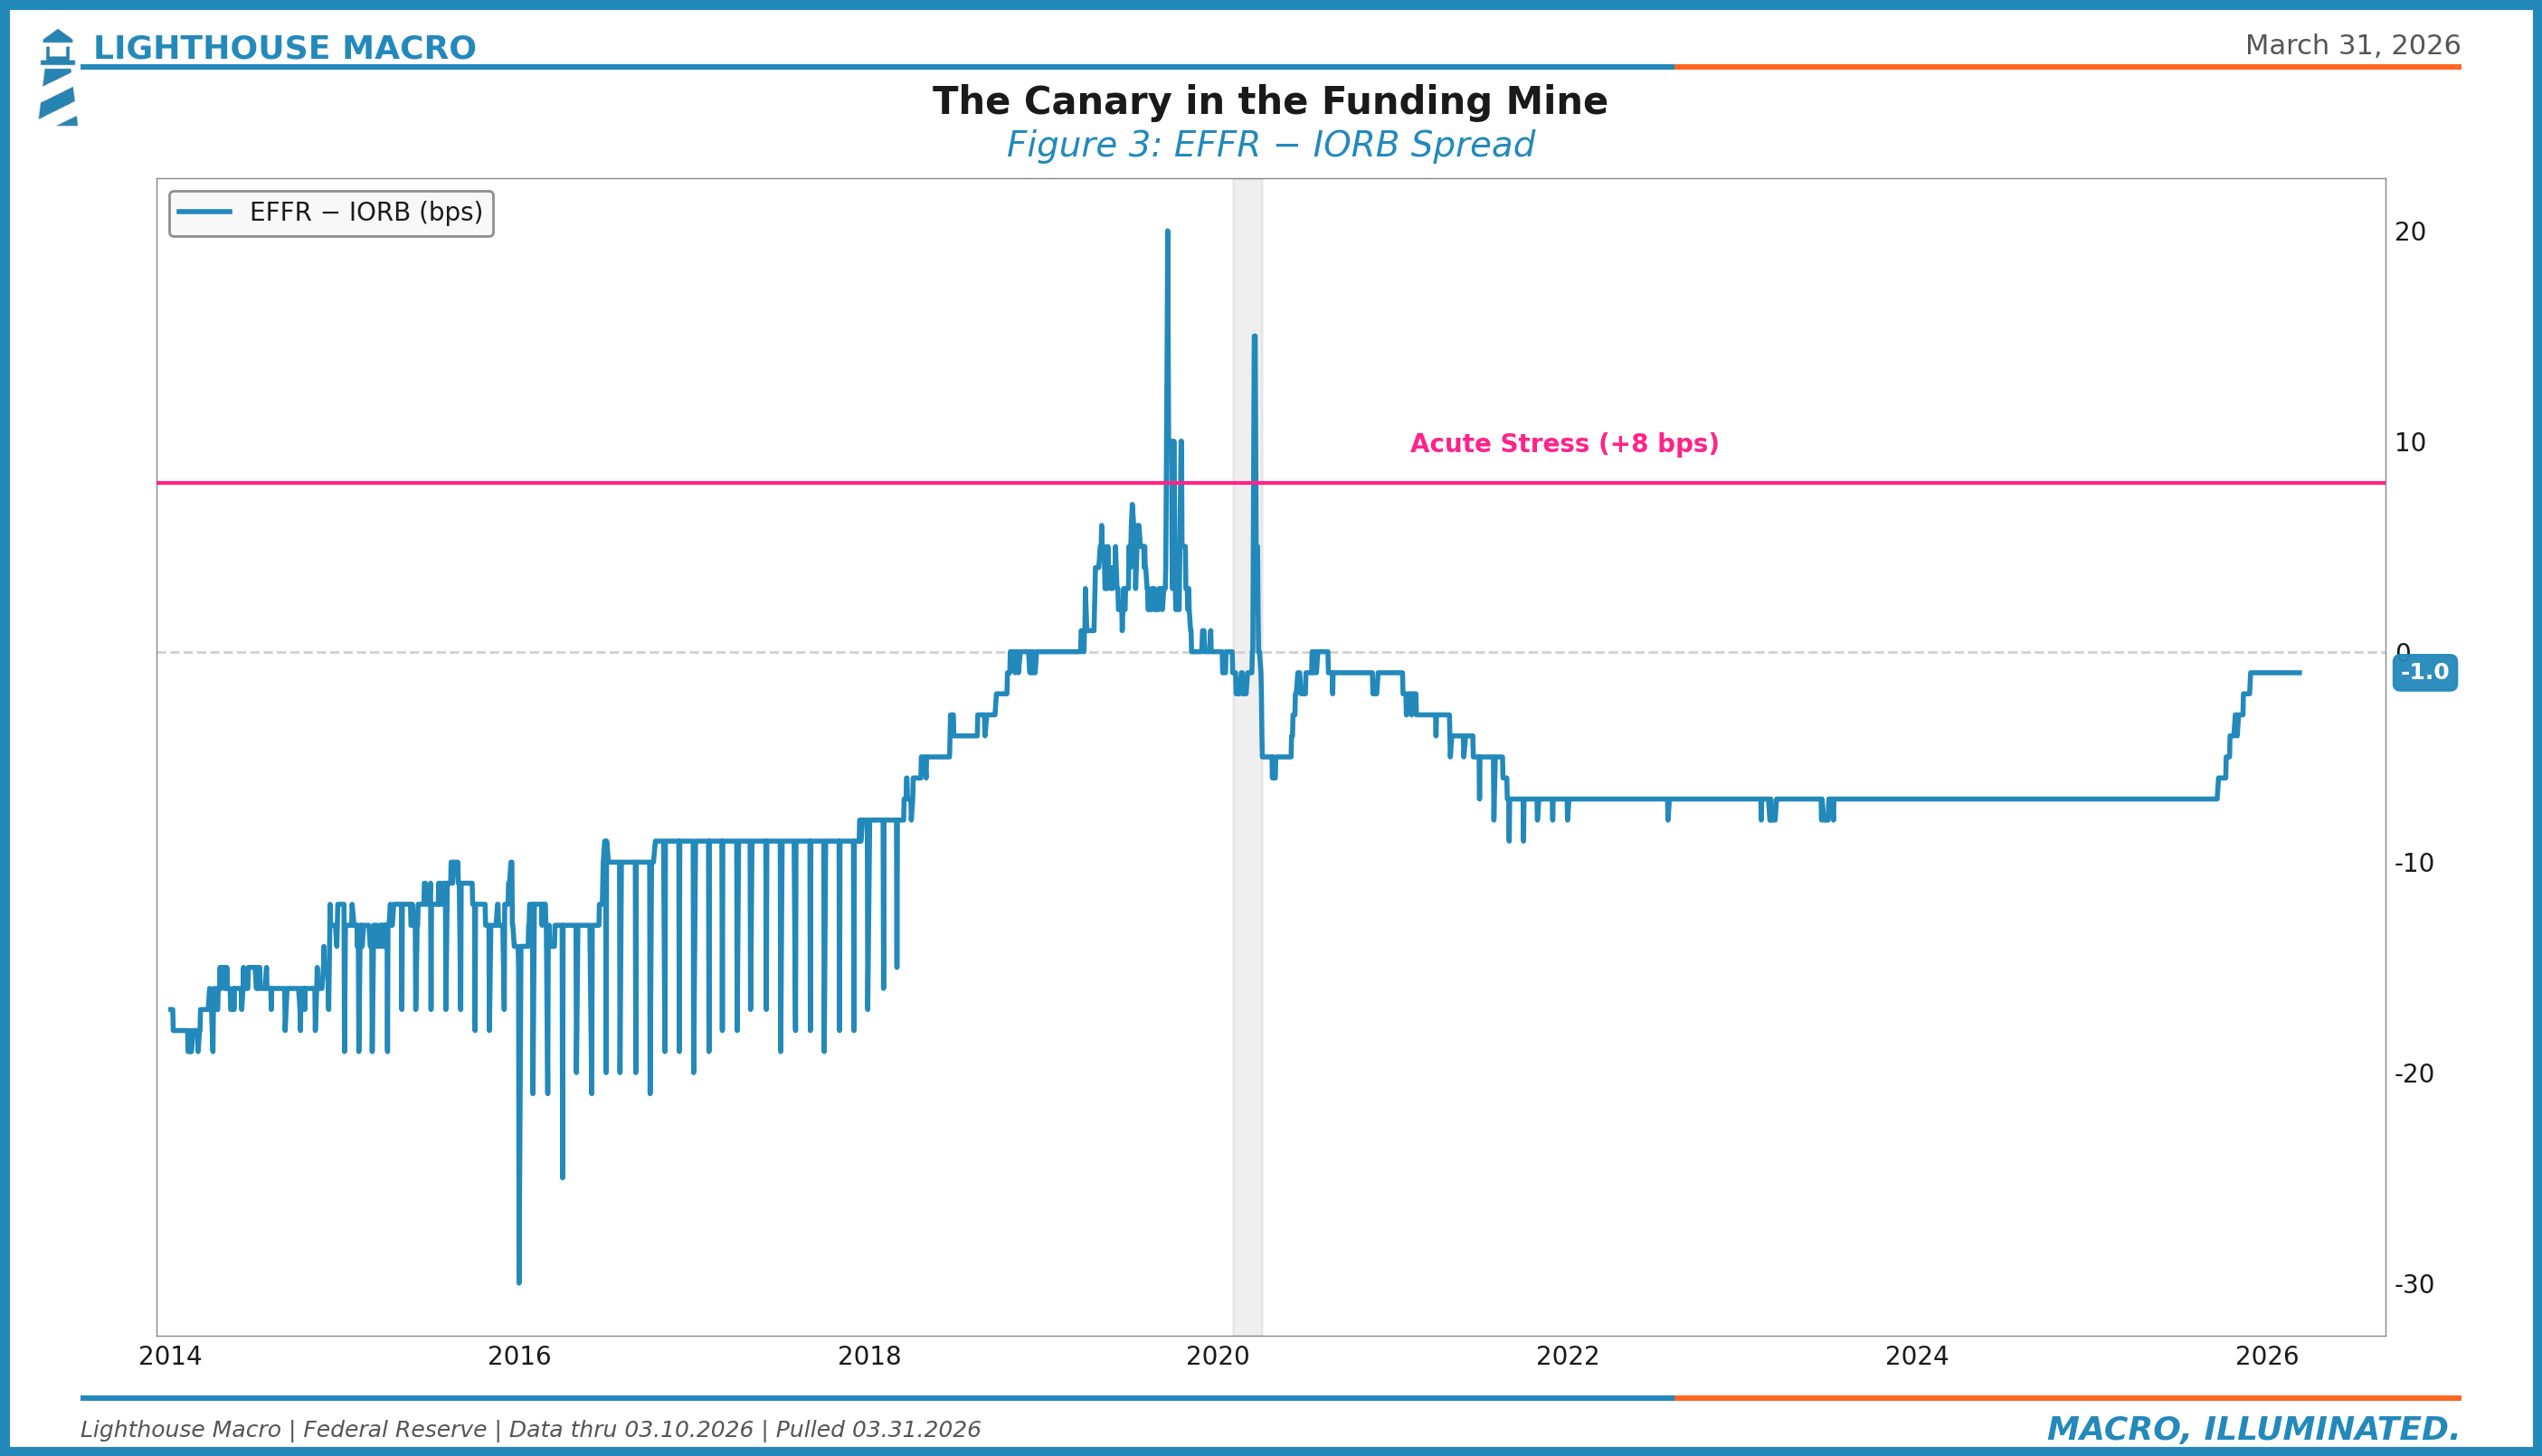
The federal funds market is a shadow of what it used to be. Before 2008, this was the heartbeat of the financial system: banks lending reserves to each other overnight. Today, it’s closer to a vestigial organ. Volume has collapsed because banks are awash in excess reserves from over a decade of QE. No bank needs to borrow fed funds to meet reserve requirements anymore.
The market that remains is dominated by a regulatory arbitrage. Federal Home Loan Banks (FHLBs), which cannot earn interest on reserves at the Fed, lend to foreign banks who can. The foreign banks pocket the spread between IORB and EFFR. It’s a plumbing quirk, not a market signal of interbank trust.
But here’s why it still matters: the spread between EFFR and IORB tells you how aggressively non-bank lenders are competing for returns. When EFFR sits comfortably below IORB, cash is abundant and nobody’s scrambling. When EFFR starts climbing toward IORB, or above it, the arbitrage is breaking down because cash itself is getting scarce. An EFFR-IORB spread above +8 basis points is our threshold for acute funding stress.
Right now, this spread is well-behaved. Boring, even. But boring is good. The value of monitoring it isn’t catching the current reading. It’s knowing the number that tells you when boring ends.
4. SOFR-IORB: Where Sep 2019 Started
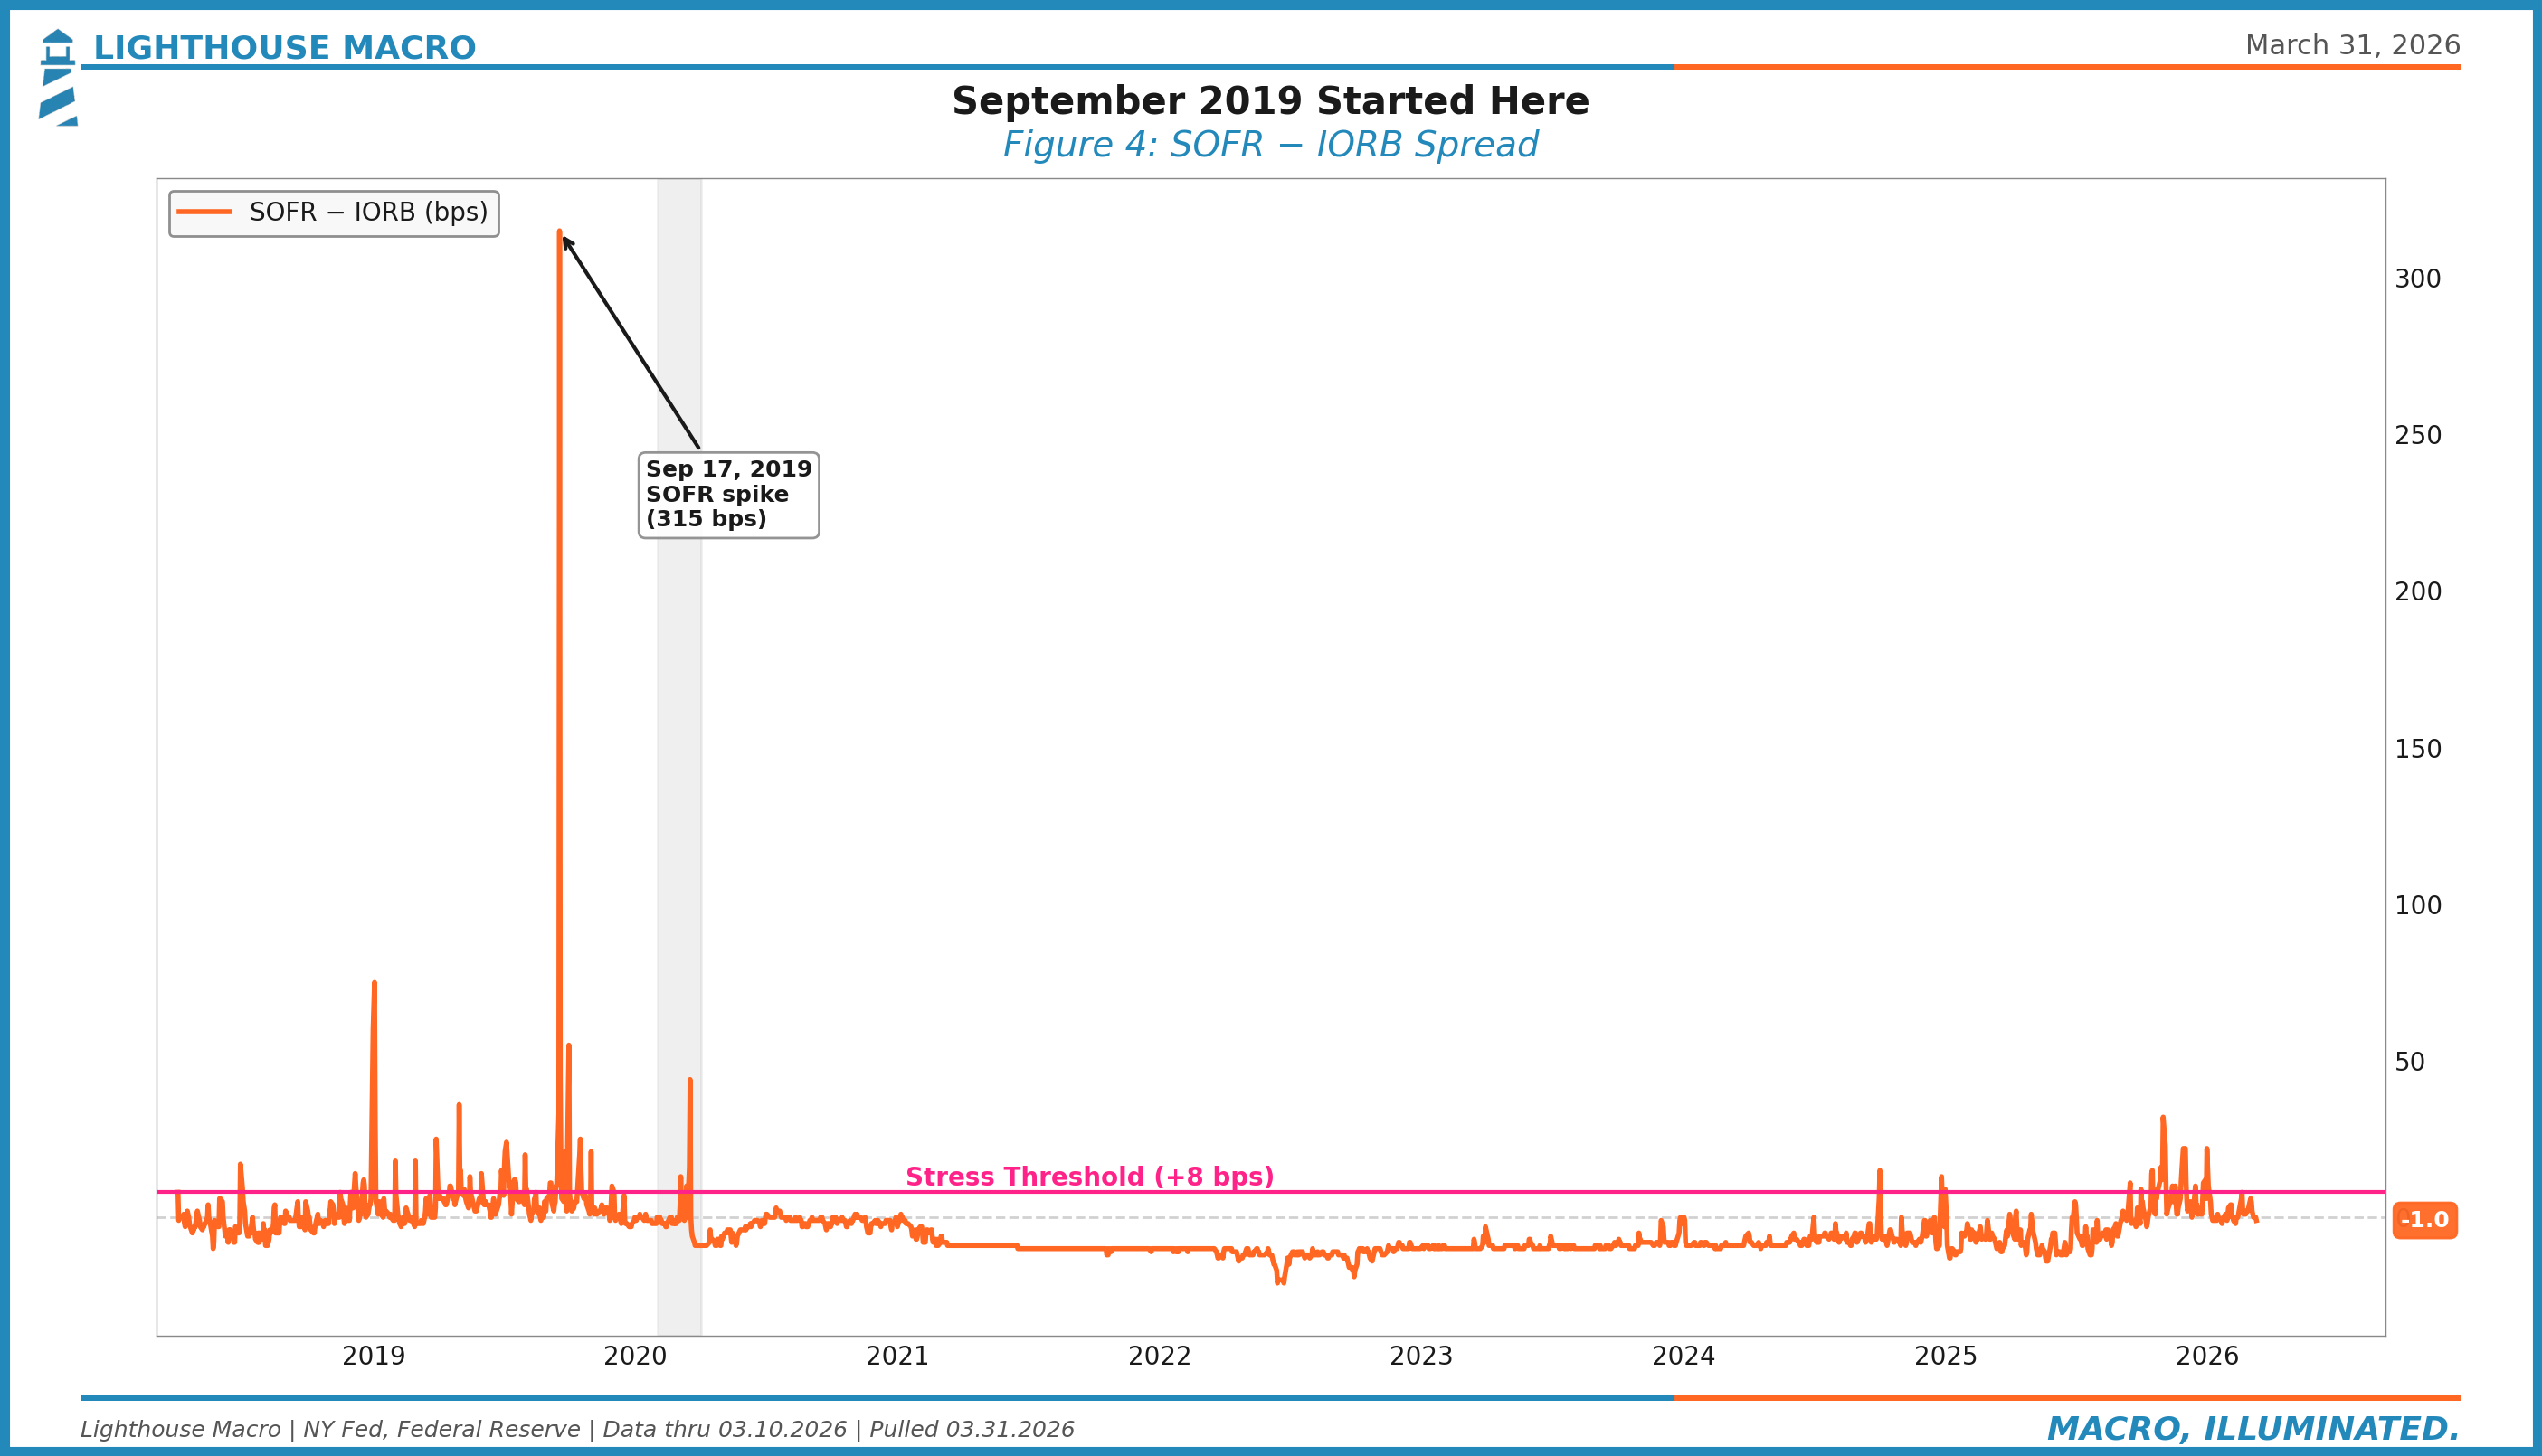
SOFR (Secured Overnight Financing Rate) is the heartbeat of the repo market. It reflects the rate at which dealers and institutions borrow cash overnight against Treasury collateral. Under normal conditions, SOFR trades near or slightly below IORB.
Here’s the structural wrinkle that matters: in a textbook, secured lending (where you have collateral) should always be cheaper than unsecured lending (where you don’t). But in today’s regulatory regime, SOFR frequently trades above EFFR. Why? Because lending cash in repo requires a bank to expand its balance sheet. Under SLR rules, that expansion requires capital. If the spread the dealer earns is only a few basis points, the return on equity is too low to justify the trade. So dealers demand a premium, pushing secured rates higher.
The SOFR-IORB spread, then, isn’t just measuring liquidity. It’s measuring dealer willingness to intermediate. When this spread widens, it means balance sheet capacity, not cash, is the binding constraint. That’s a fundamentally different kind of stress, and it’s harder for the Fed to fix because the solution isn’t more reserves. It’s regulatory relief.
September 17, 2019, SOFR printed at 5.25%, more than 300 basis points above the upper bound of the target range. The repo market, the most liquid overnight market in the world, had frozen. Not because of a crisis. Because of a plumbing failure: reserves were unevenly distributed, corporate tax payments had drained cash, and Treasury settlement absorbed what was left. The pipes clogged.
The Fed launched standing repo facilities and resumed balance sheet expansion within weeks. The lesson: the damage happens before the fix arrives.
5. SOFR-EFFR: The Dealer Capacity Barometer
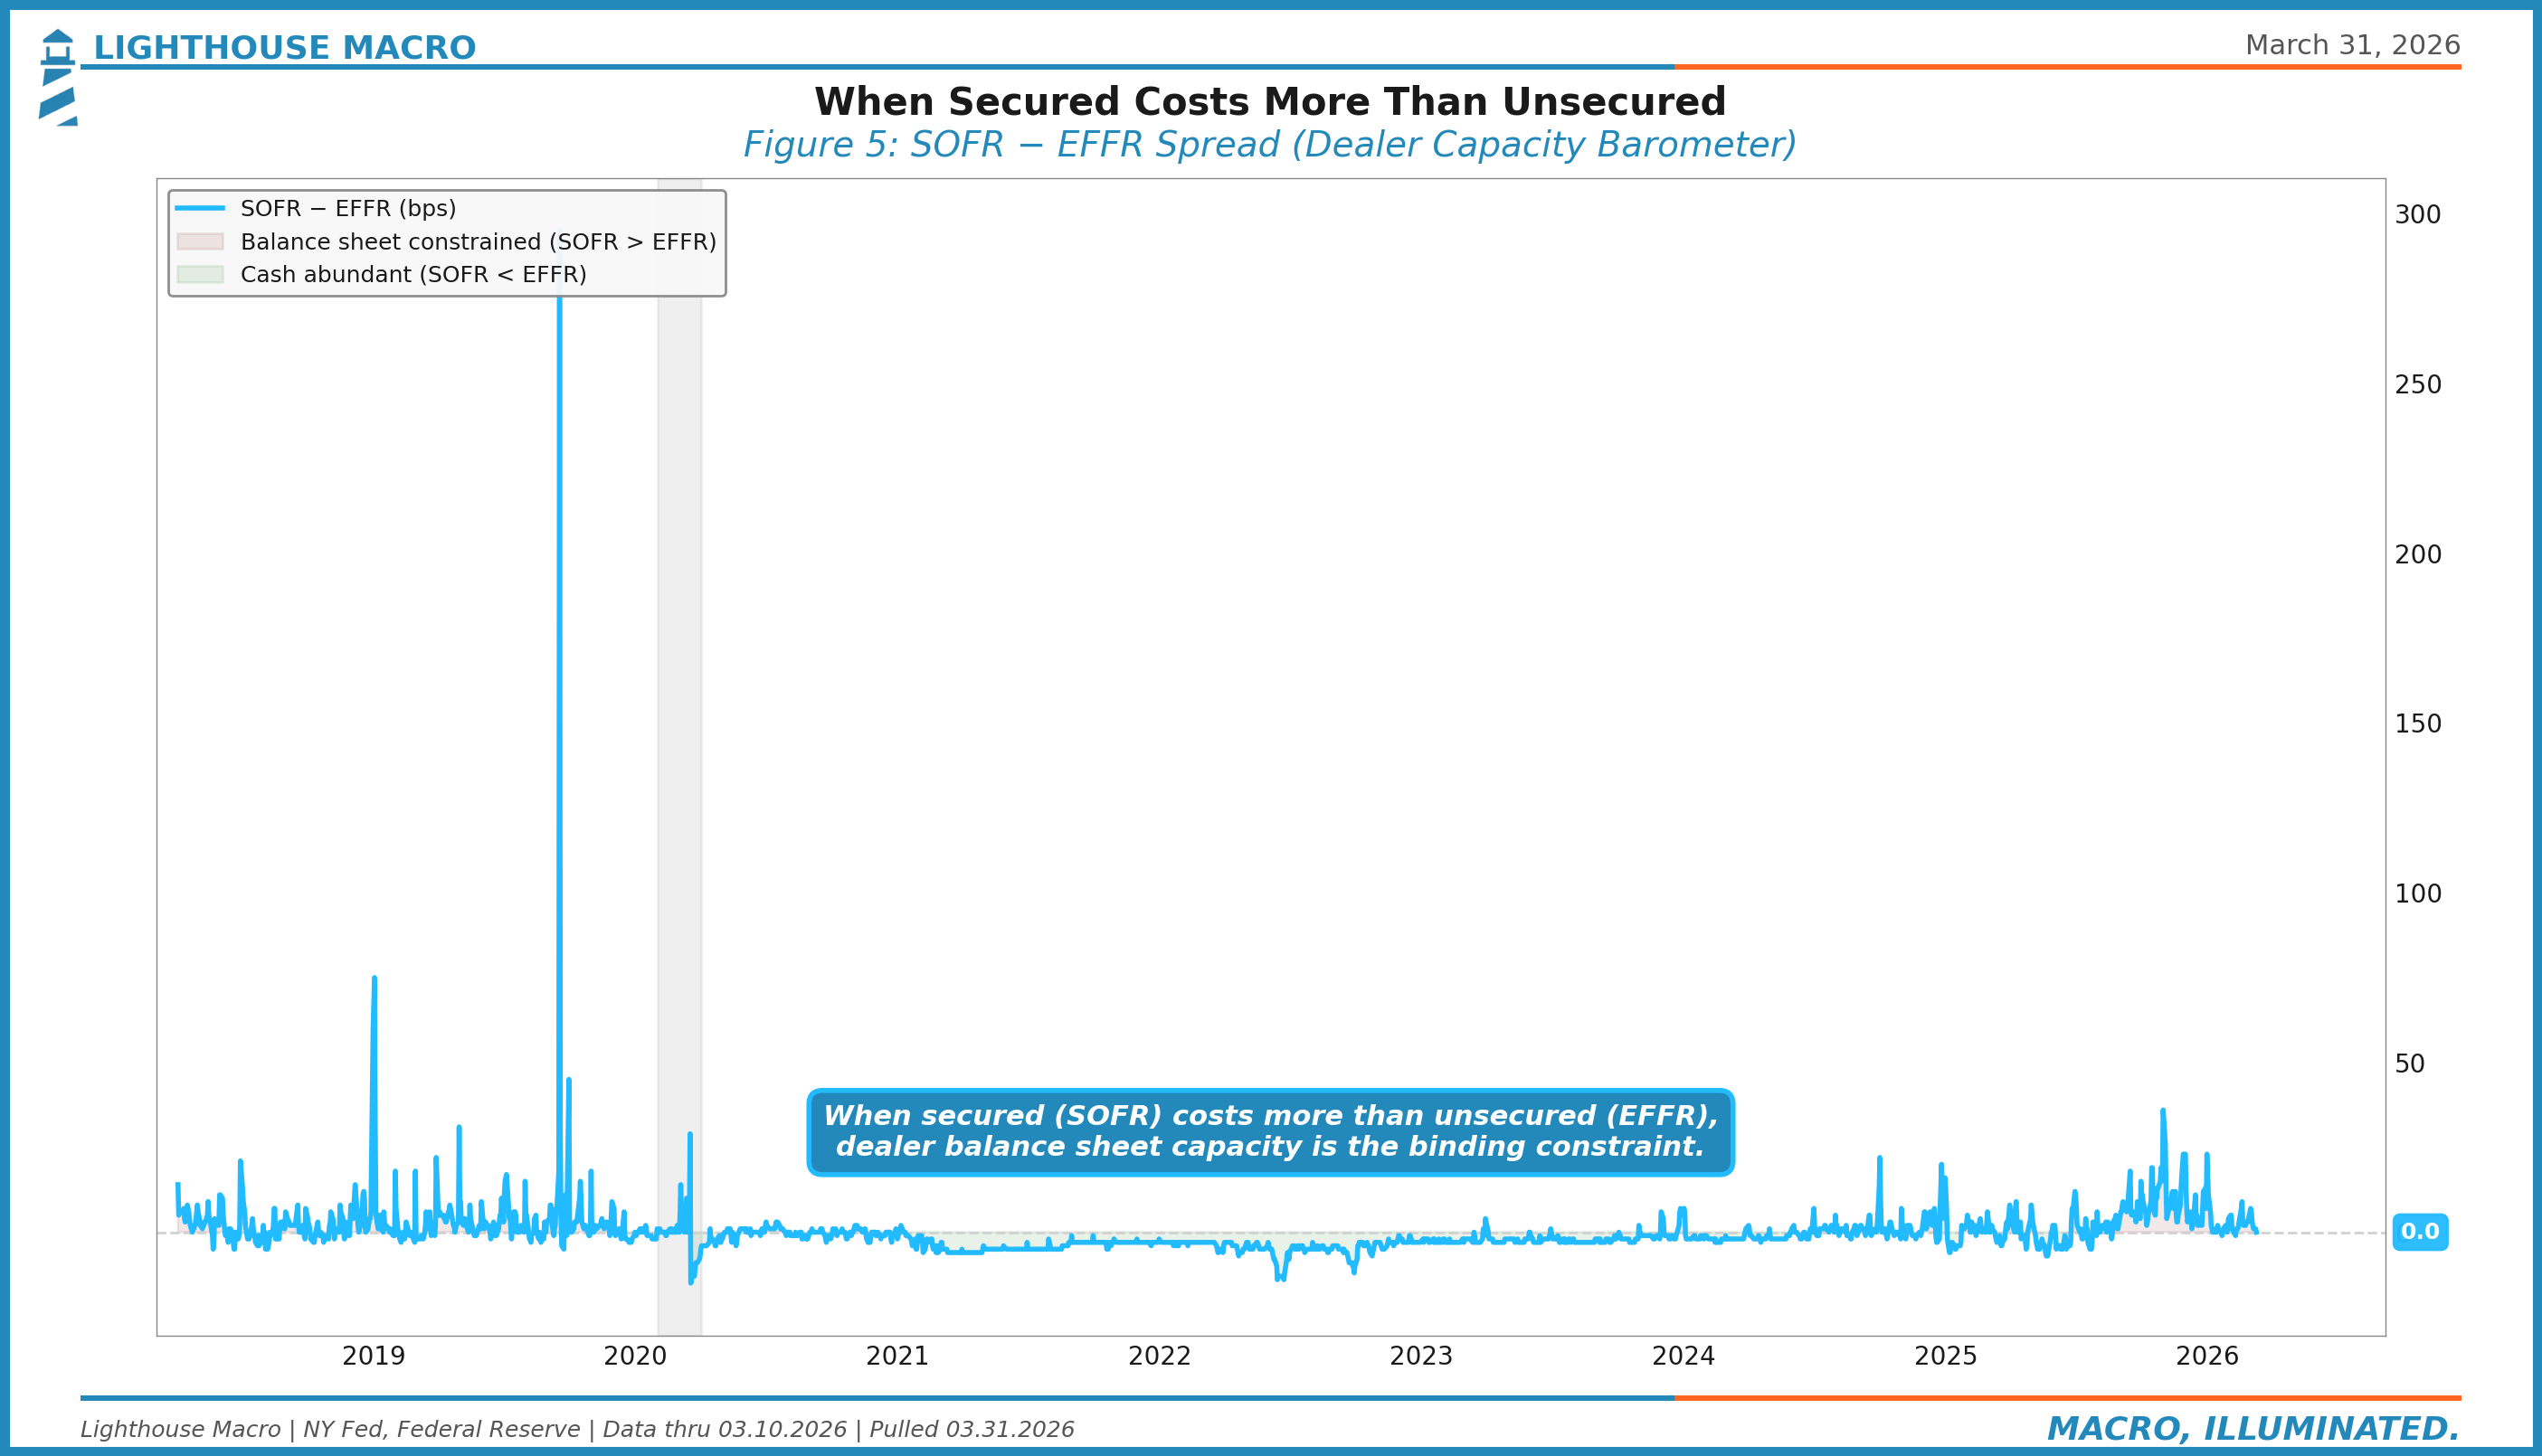
This chart distills the SLR story into a single line. When SOFR trades below EFFR (negative spread), the system is functioning as textbooks predict: secured lending is cheaper than unsecured. Cash is abundant, collateral is scarce, and dealers are happy to intermediate.
When SOFR trades above EFFR (positive spread), the hierarchy has inverted. Balance sheet capacity, not cash or credit risk, has become the binding constraint. Dealers are effectively saying: “I could lend you cash against your Treasuries, but it costs me capital to do so, and the return isn’t worth it.”
Watch for sustained positive readings, not just quarter-end spikes. A persistently positive SOFR-EFFR spread is the market pricing in structural dealer constraints. That’s the regime we’re in now, and it’s the regime that makes every other plumbing signal more consequential.
6. The Fed Balance Sheet: QT’s Quiet Drain
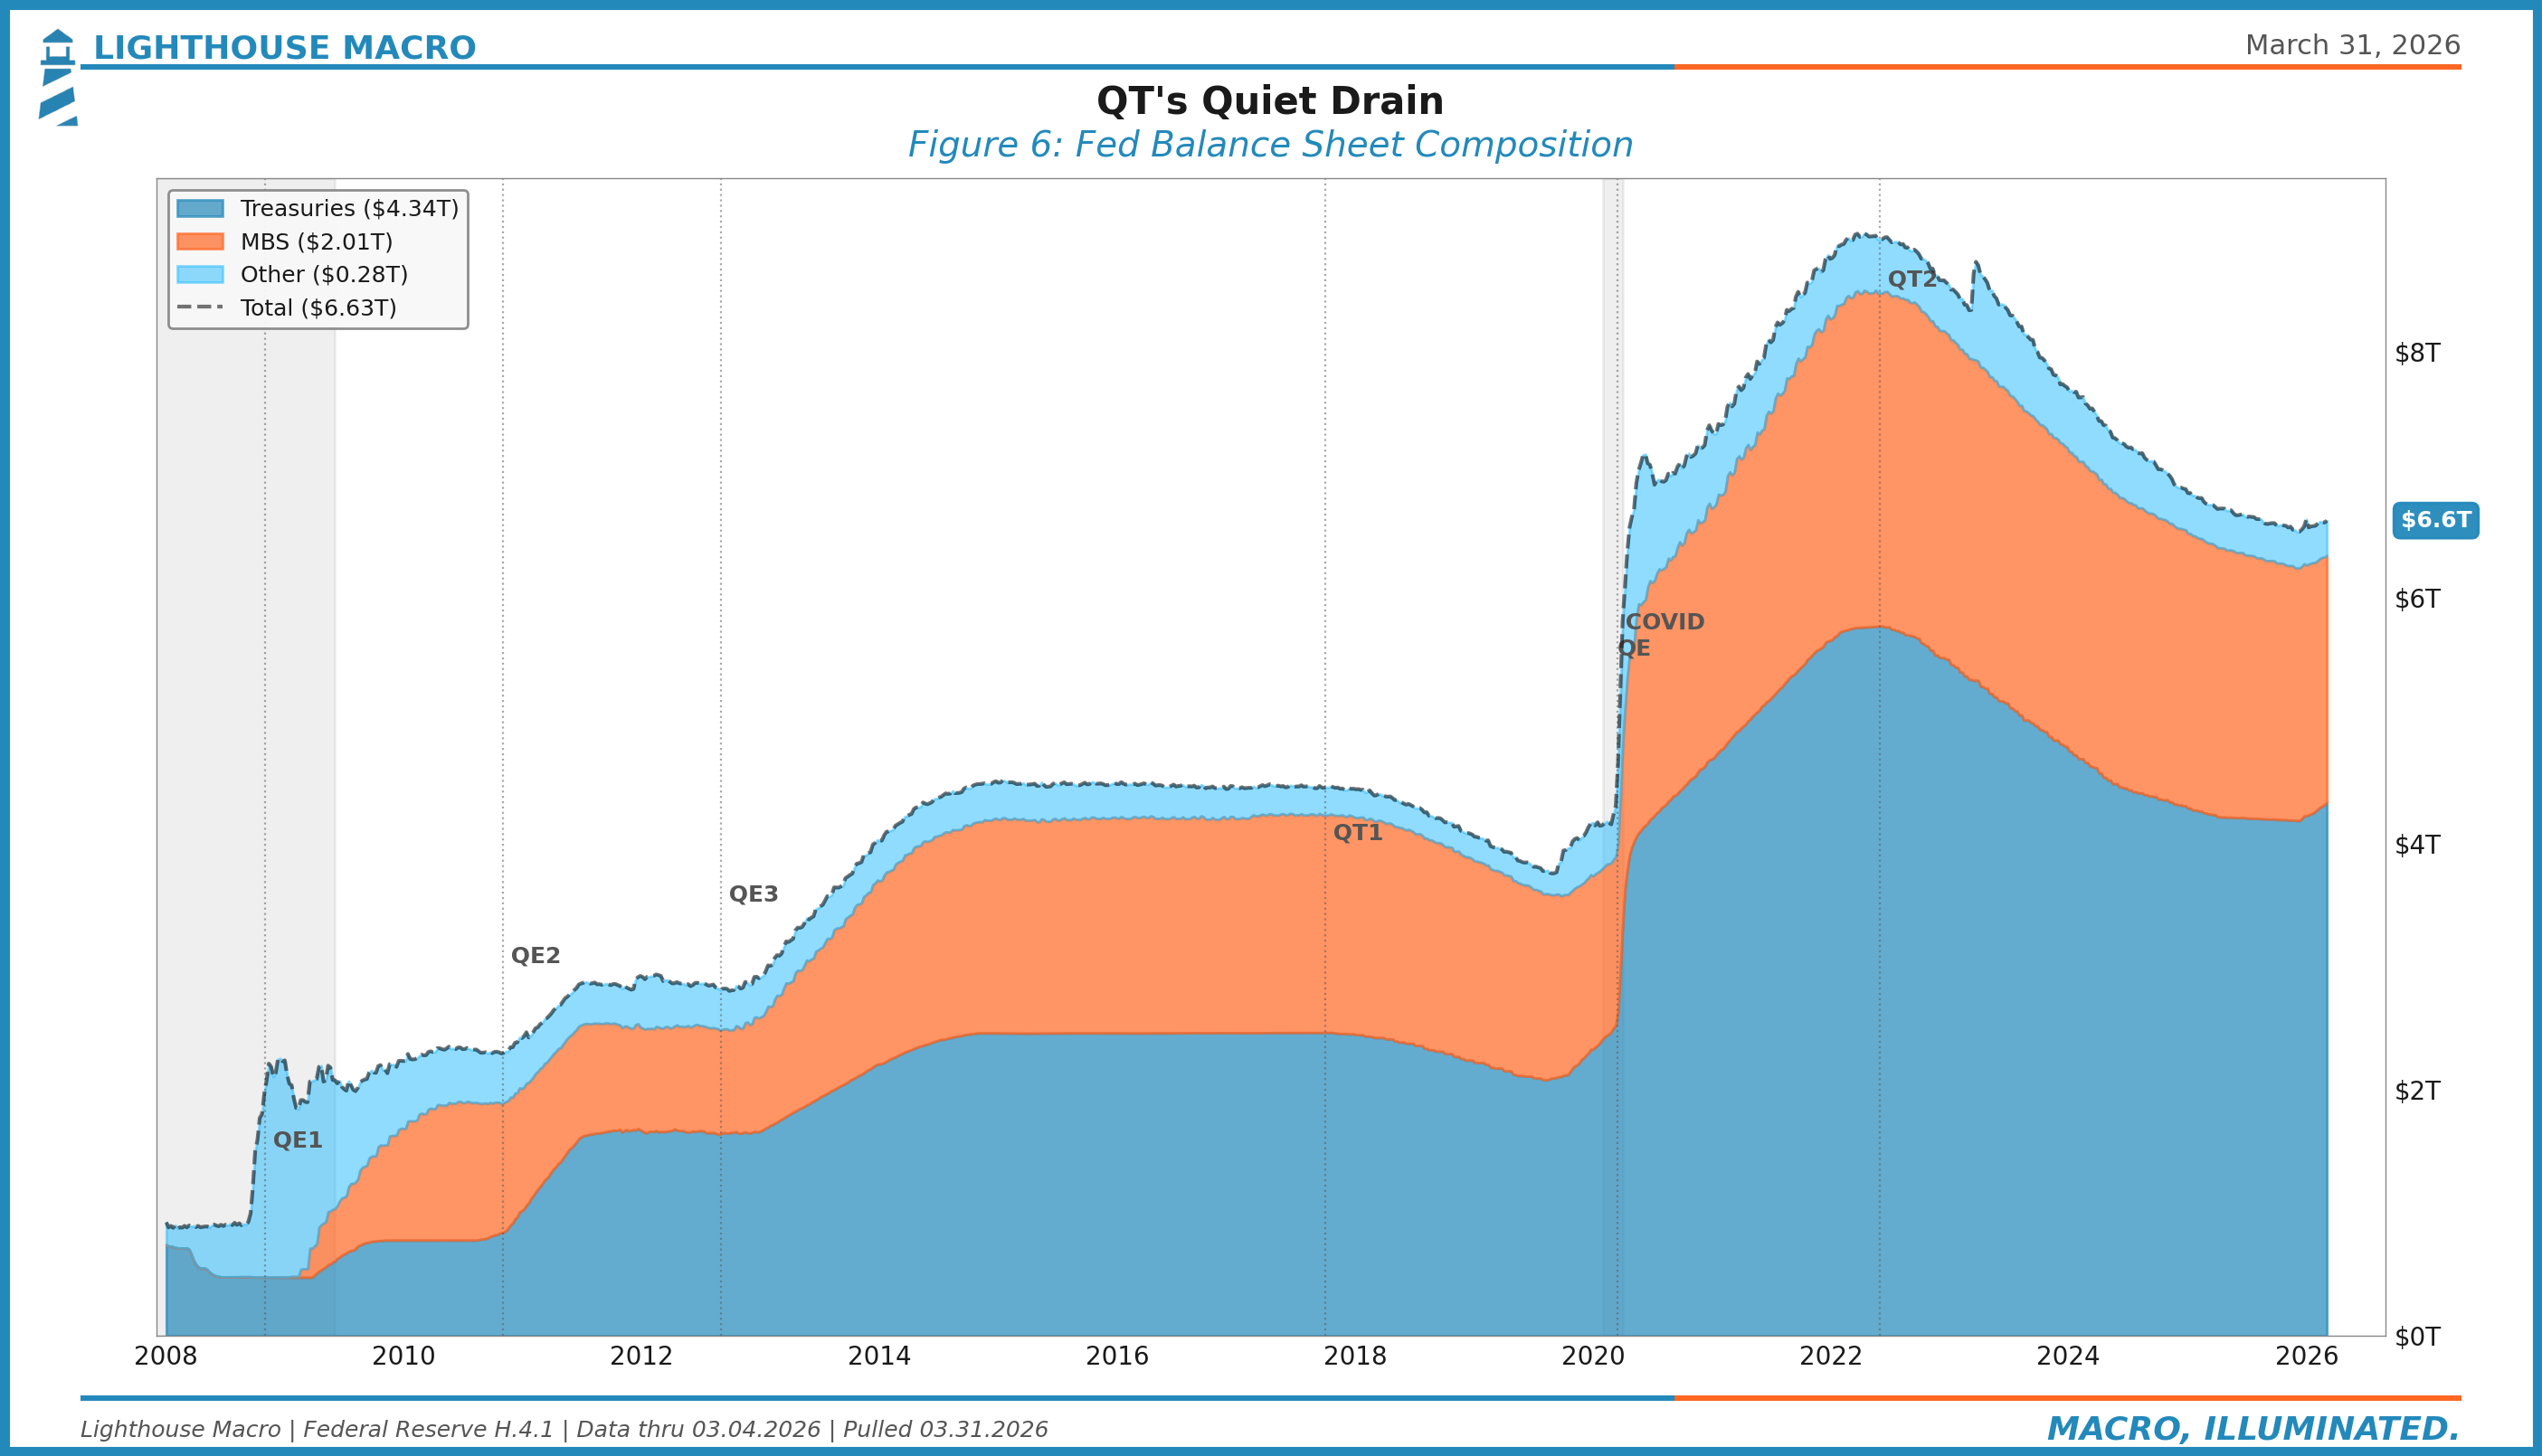
The Fed’s balance sheet tells you the trajectory. QT, which ran from June 2022 through November 2025, mechanically removed over $2.2 trillion in securities from the Fed’s holdings. The FOMC ended the runoff on December 1, 2025, directing the Desk to roll over all maturing Treasuries and reinvest all agency MBS principal payments into Treasury bills.
The end of QT was the right call given money market signals, but it doesn’t mean the balance sheet story is over. Reserves can still decline as other liabilities grow. Currency in circulation increases with the economy. TGA swings can pull hundreds of billions in reserves out of the banking system over weeks. And the composition of the Fed’s holdings matters: as Treasuries were redeemed during QT, the Fed now holds a proportionally larger share of MBS, which are less liquid and harder to manage.
Watch the balance sheet not for the runoff (it’s over) but for the trajectory of reserves relative to total liabilities. The Fed has indicated it will conduct reserve management purchases of Treasury bills to keep reserves at ample levels. Whether that mechanism works smoothly is the next test.
7. The TGA: Washington’s Checking Account
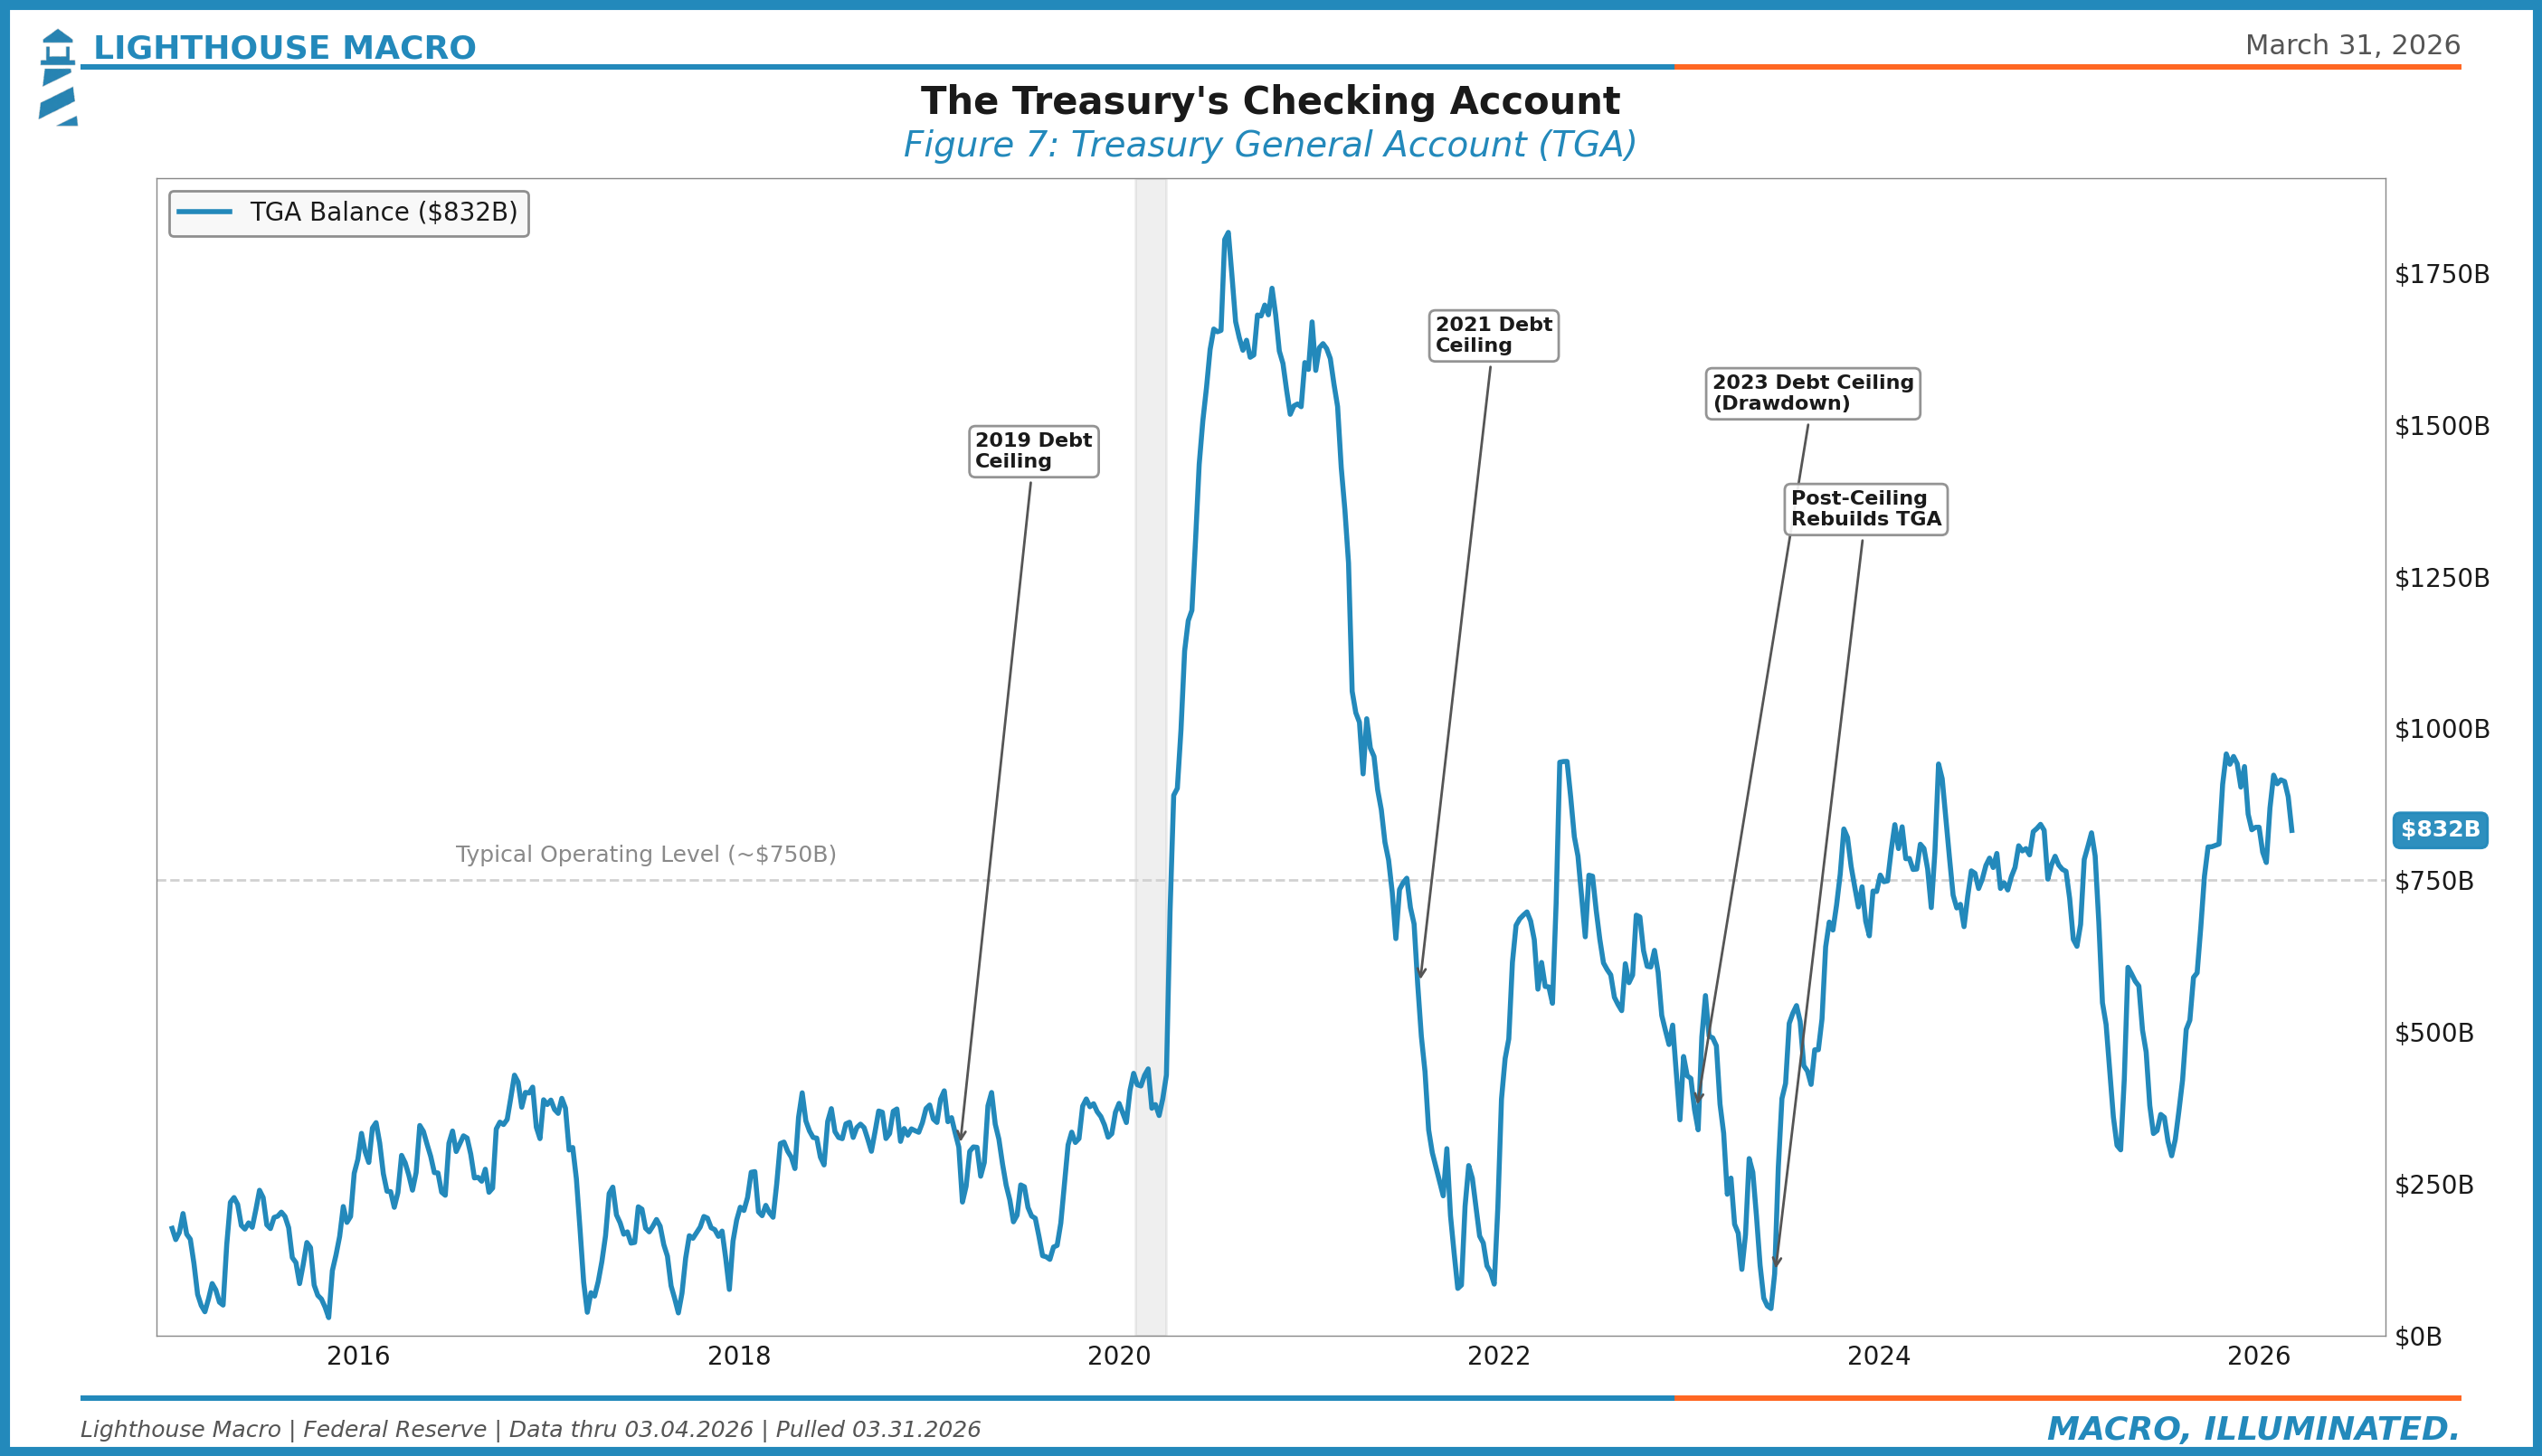
The Treasury General Account is the US government’s operating balance at the Fed. When the Treasury issues debt and collects taxes, the TGA fills up, pulling reserves out of the banking system. When the Treasury spends, the TGA drains and reserves flow back to banks.
This makes the TGA a reserve shock absorber, but an unreliable one. Debt ceiling episodes create massive, artificial swings. When the ceiling binds, the Treasury draws down the TGA, flooding the system with reserves (paradoxically easing funding conditions). When the ceiling lifts, Treasury rebuilds the TGA with a wave of issuance, yanking reserves back out.
The 2023 debt ceiling resolution was a masterclass in this dynamic. The TGA rebuild sucked hundreds of billions in reserves out of the system over a few months. Funding spreads barely moved because the RRP cushion absorbed it. Next time, there’s no RRP cushion.
8. Money Market Funds: Following the Cash
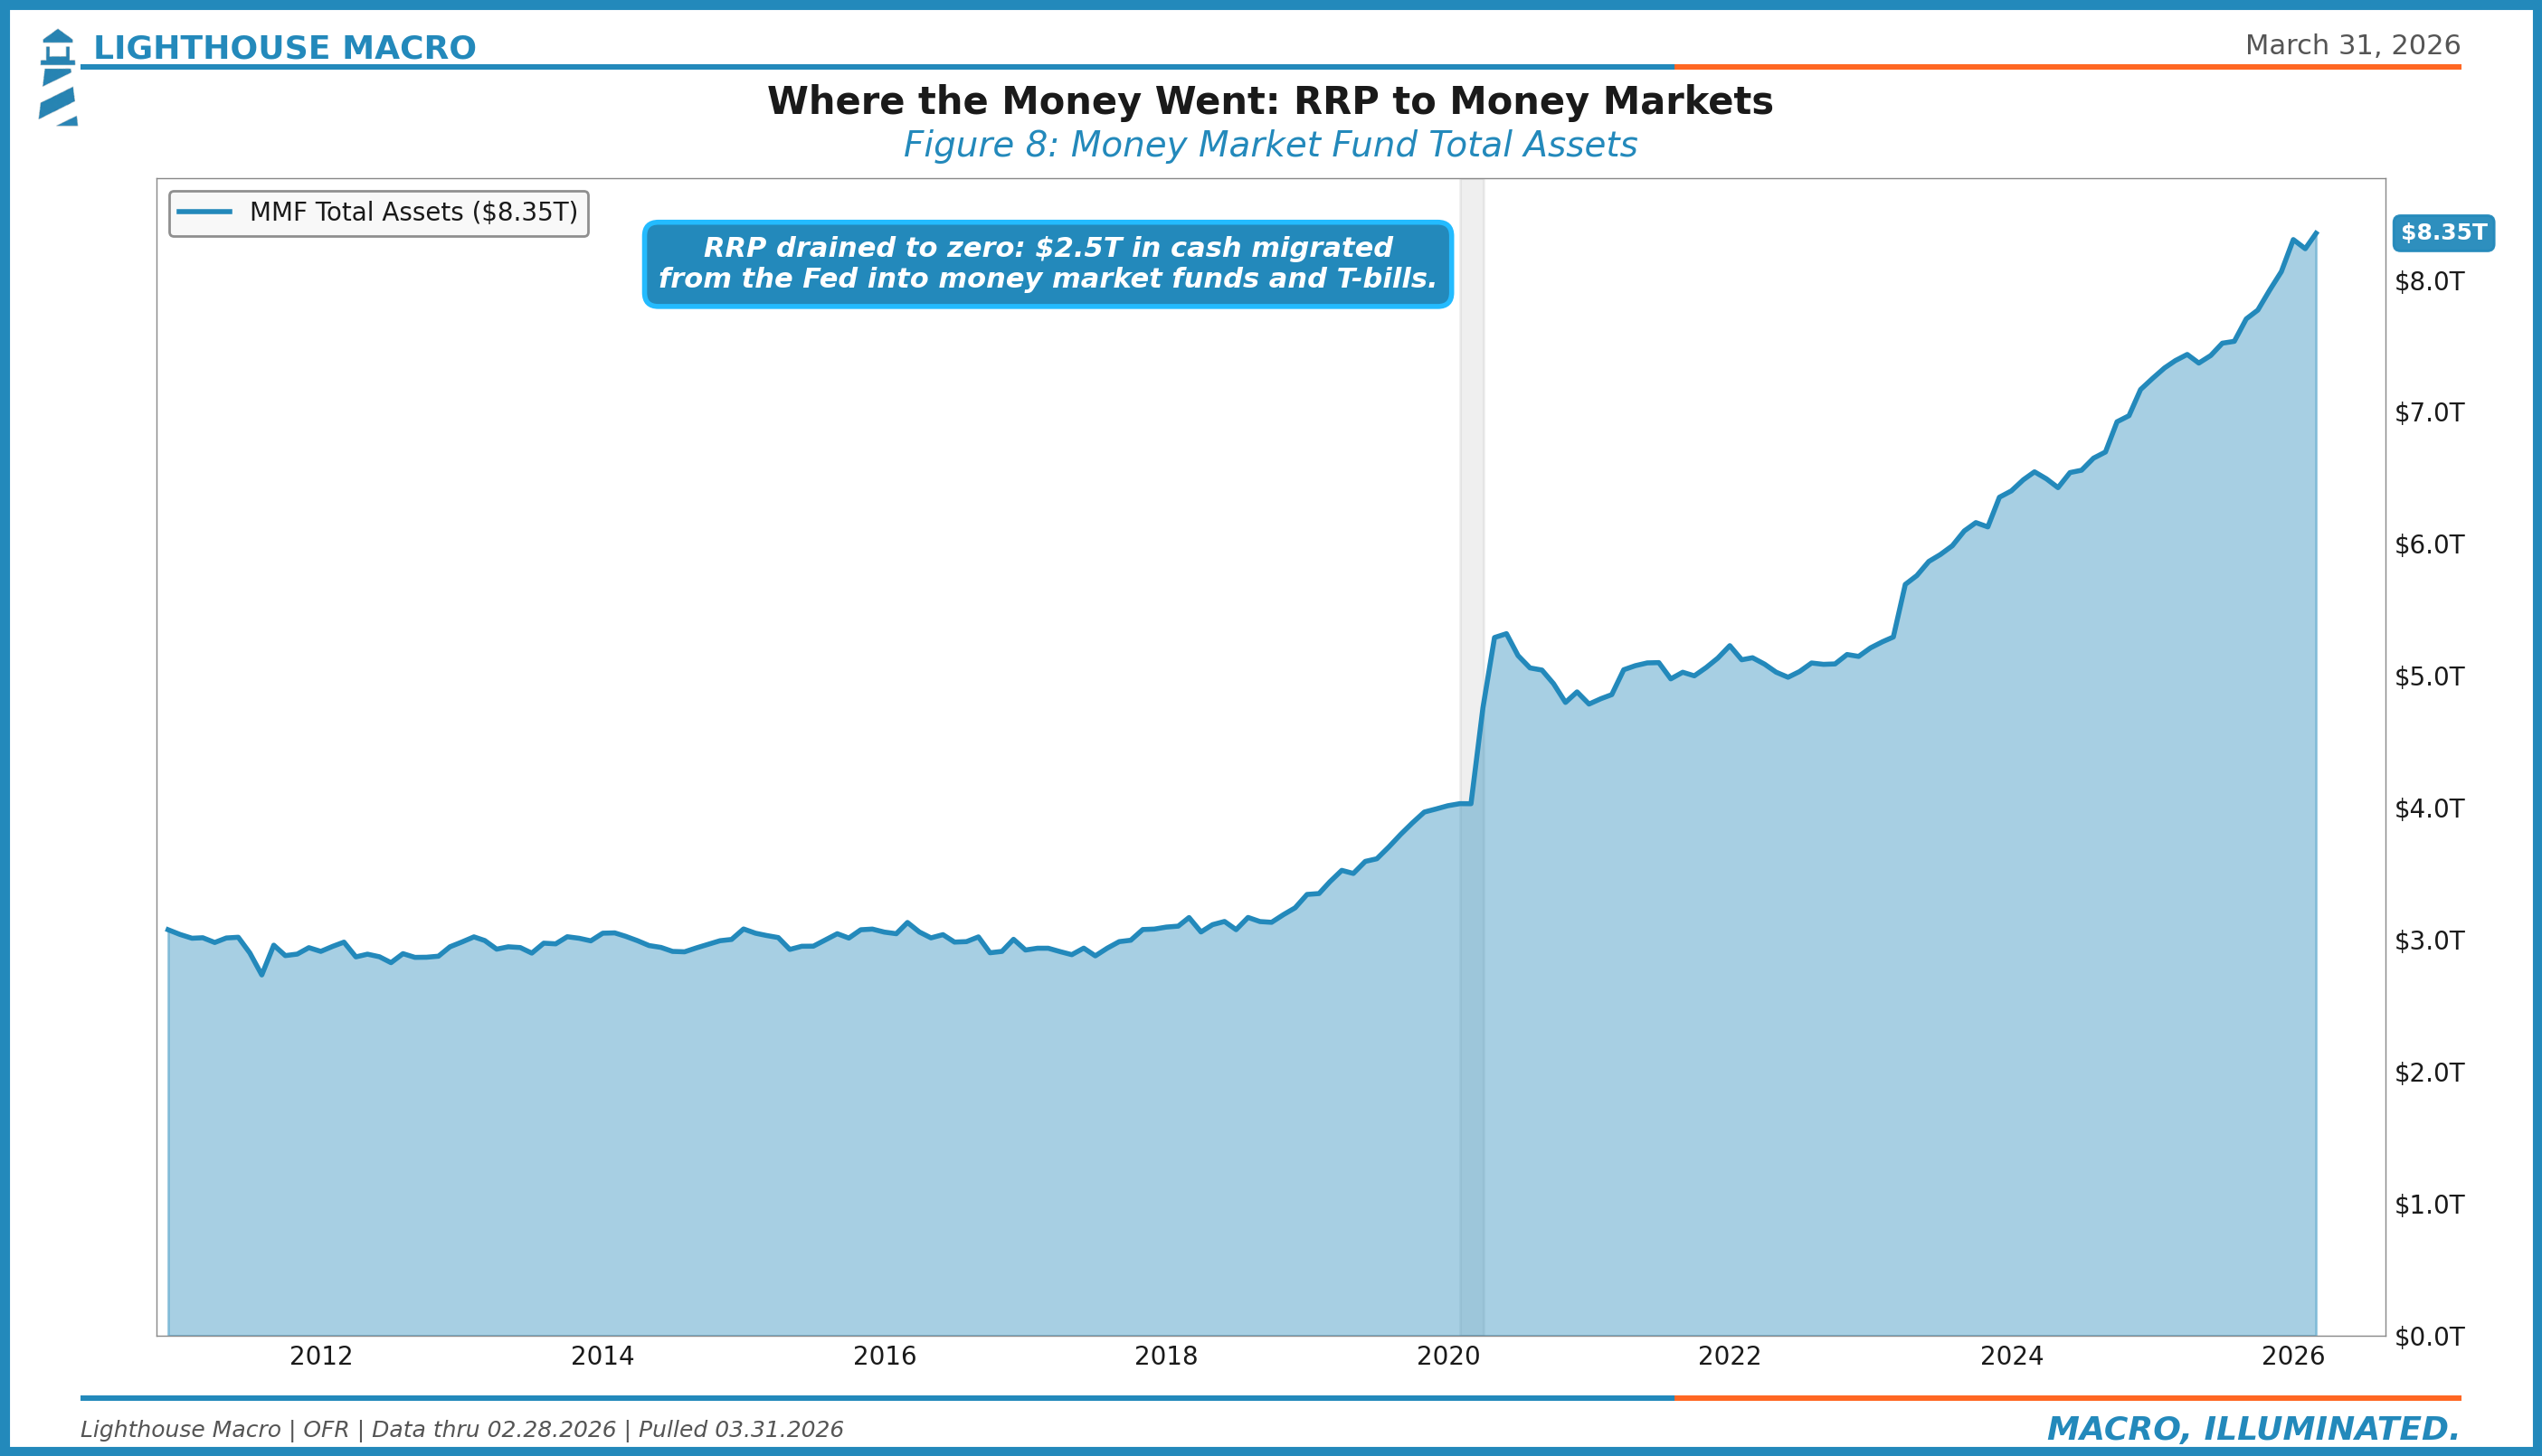
Where did the $2.5 trillion in RRP cash go? Mostly into T-bills, through money market funds. As the Treasury shifted issuance toward shorter maturities and T-bill yields sat above the RRP rate, money funds migrated their cash out of the Fed and into the bill market.
This isn’t a problem in itself. It’s actually the system working as intended. But it means the cash that was parked safely at the Fed is now deployed in the market, earning a spread, taking duration, and no longer sitting in the one place where it was unconditionally available as a reserve buffer.
Track MMF assets as a complement to RRP. When RRP is near zero and MMF assets are at record highs, the system’s liquidity hasn’t disappeared. It’s been redeployed. The question is whether it can be recalled fast enough when it’s needed.
9. OFR Funding Stress: Third-Party Validation
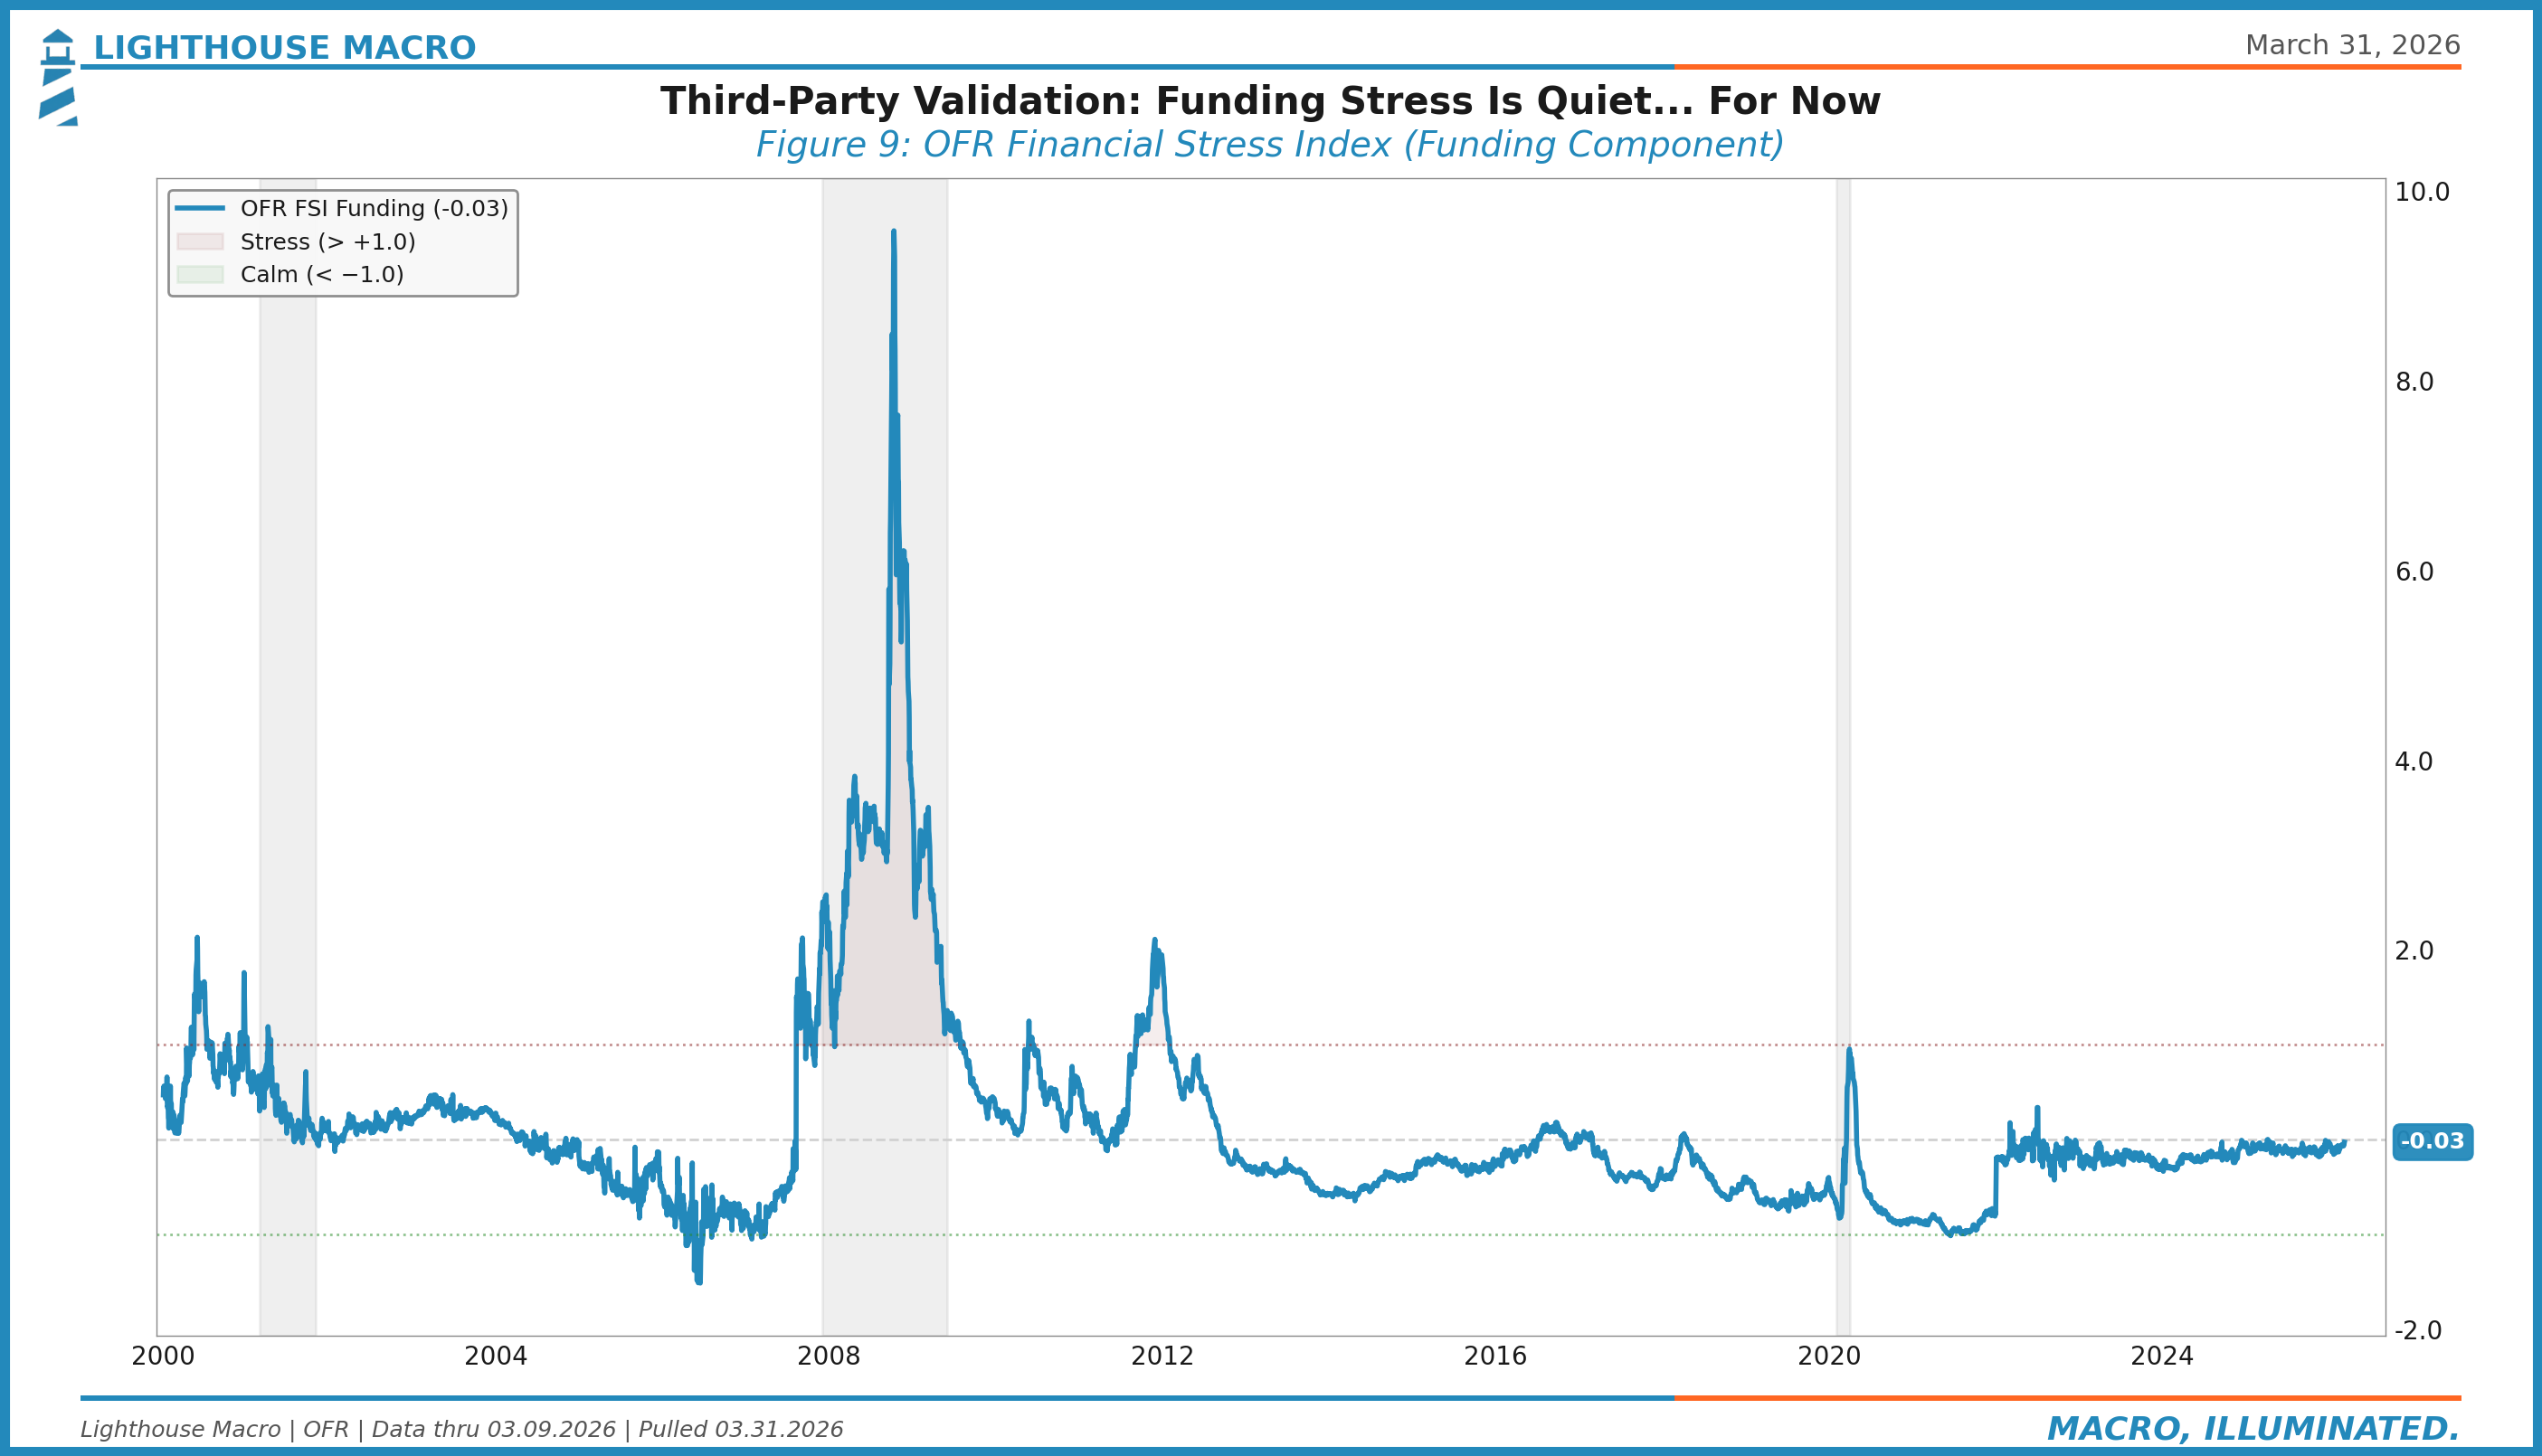
The Office of Financial Research publishes a Financial Stress Index with a specific funding component. It’s useful precisely because it’s not our indicator. It’s an independent, publicly available measure of funding market conditions.
When the OFR Funding Stress Index is calm, it confirms what the individual spreads are telling us. When it diverges from our read of the plumbing, it forces us to ask why. Either we’re wrong, or the OFR’s methodology is weighting something differently. Either way, the divergence is the signal.
10. Commercial Paper Spreads: The Unsecured Signal
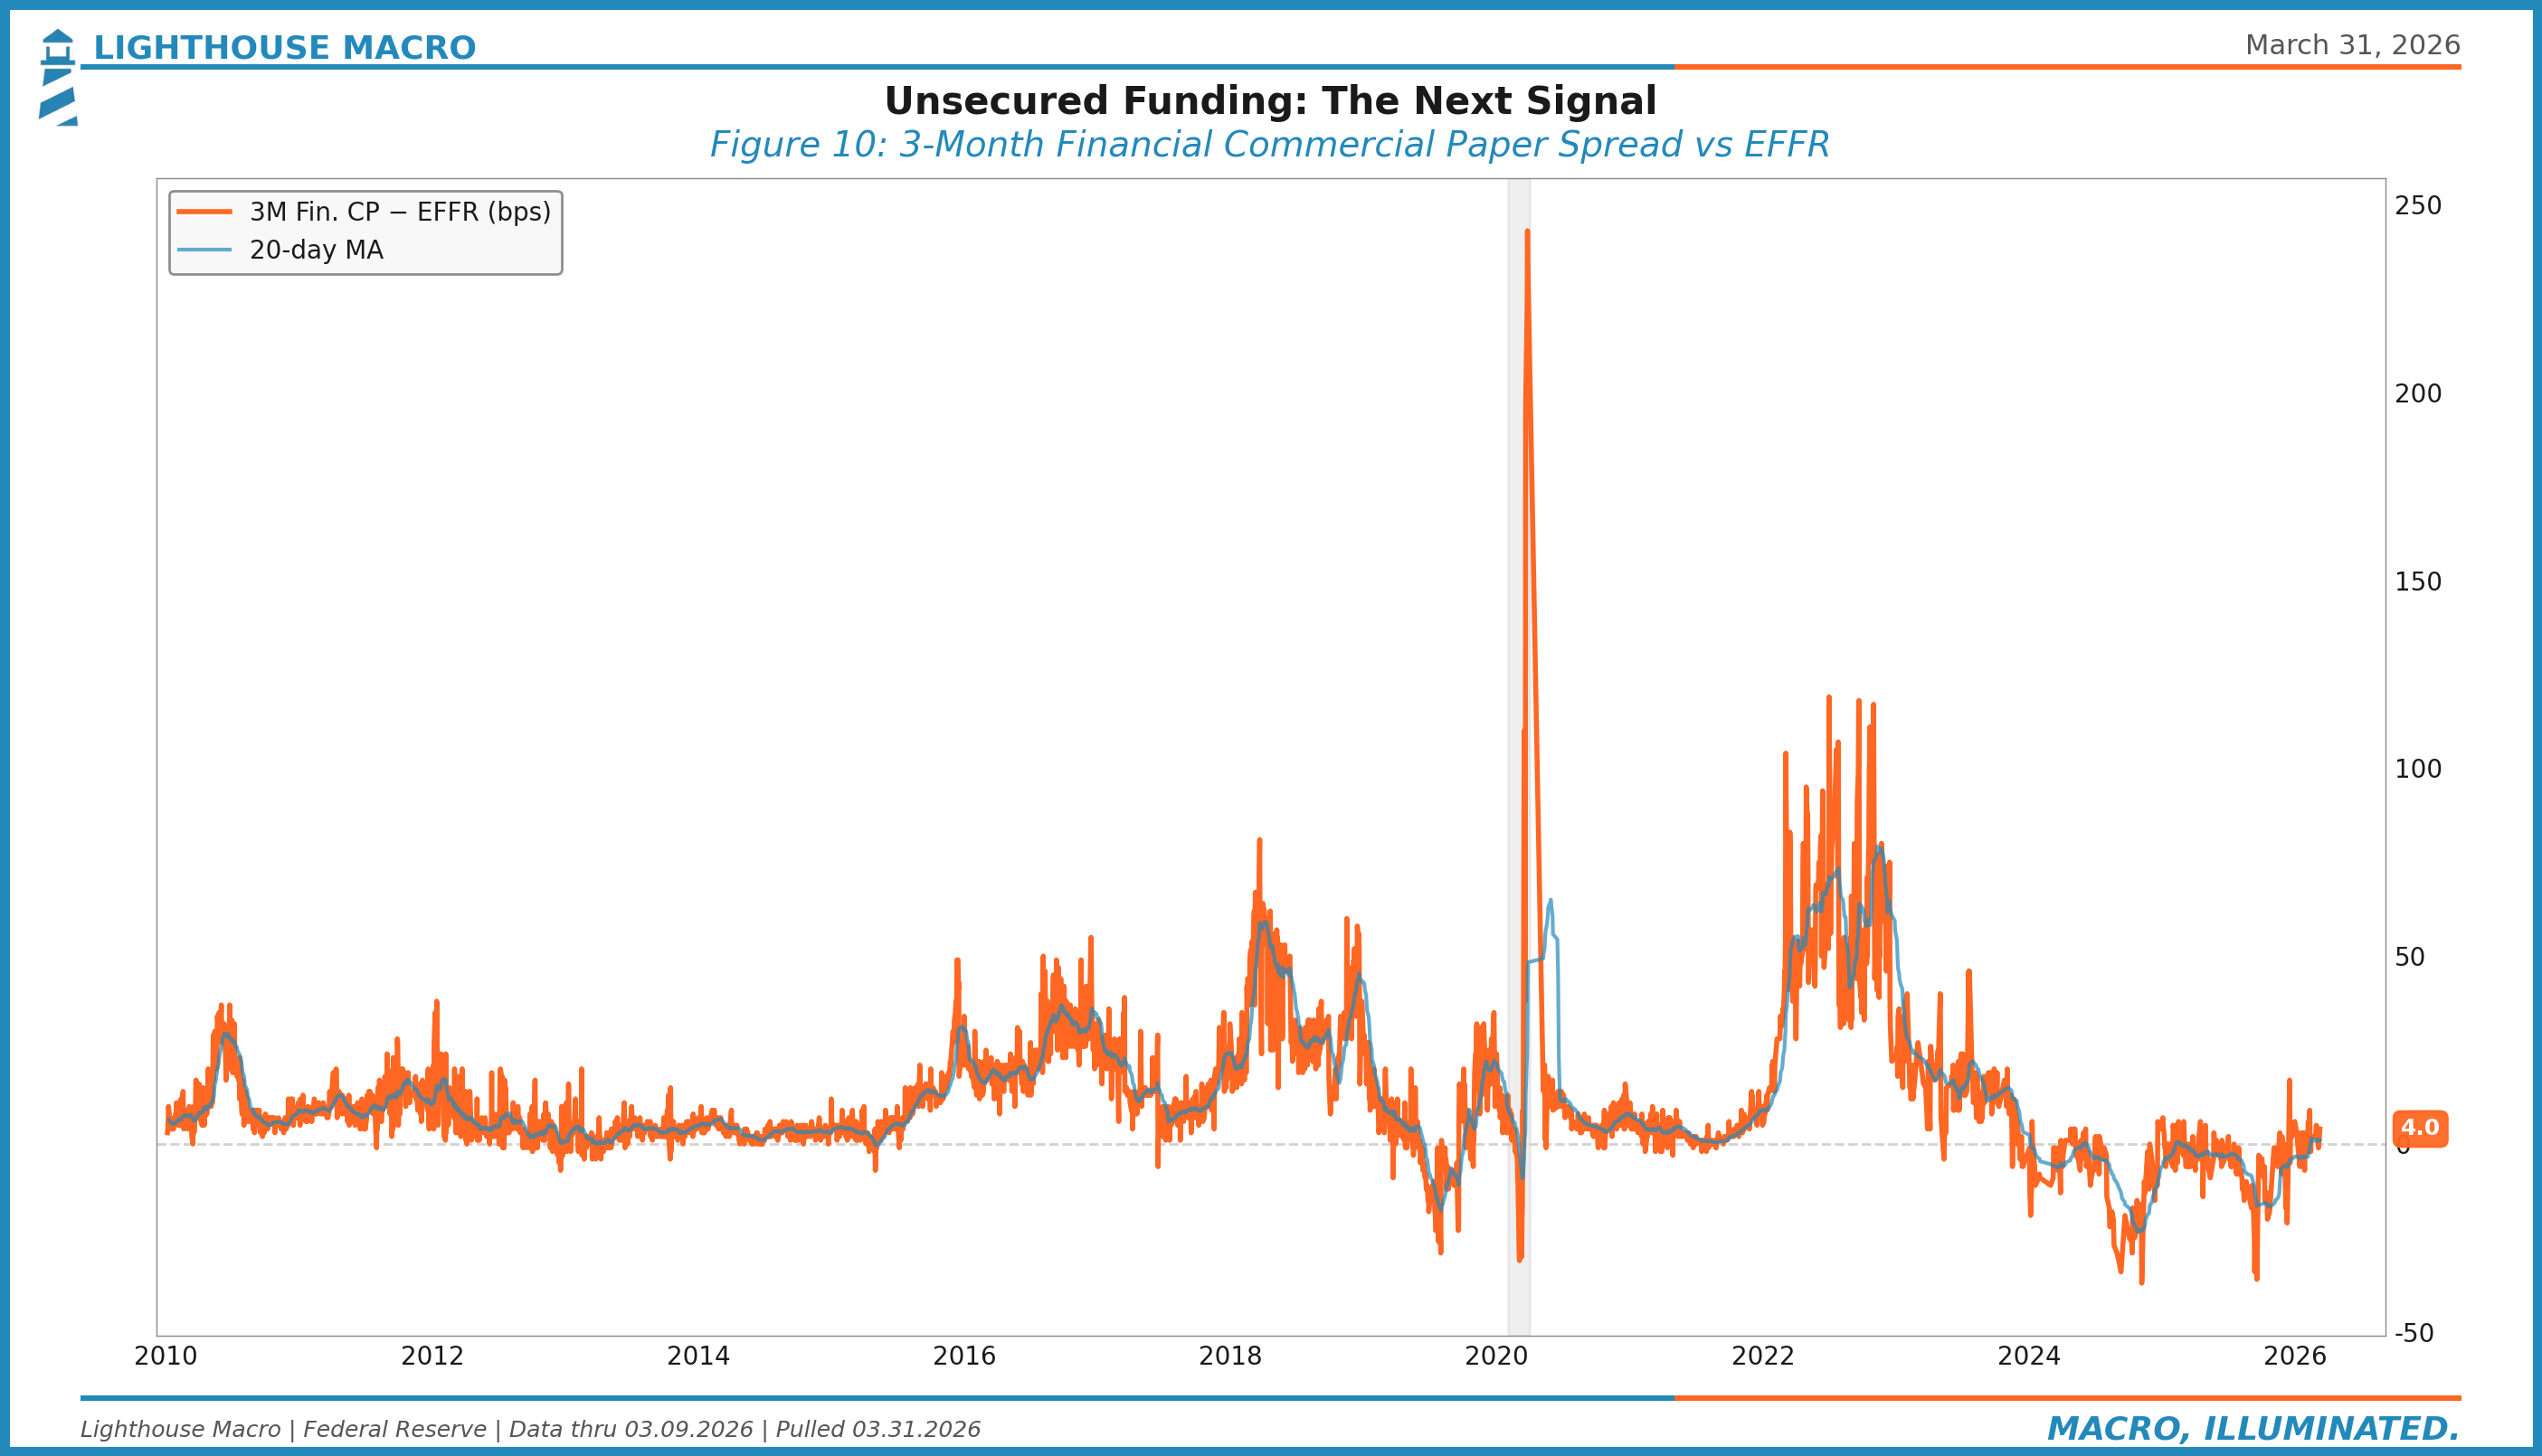
Commercial paper is how corporations borrow short-term, unsecured. The spread between CP rates and SOFR (or Fed Funds) measures the price of unsecured credit in the overnight and term markets.
When this spread widens, it means lenders are demanding a premium for credit risk, or more precisely, they’re nervous about the creditworthiness (or liquidity profile) of borrowers. CP spreads widened sharply in March 2020 before the Fed launched the Commercial Paper Funding Facility. They were an early warning in 2007, too.
In a world where repo spreads are behaving but CP spreads widen, the stress isn’t in collateralized lending. It’s in trust.
11. Net Liquidity: The Macro Twitter Favorite
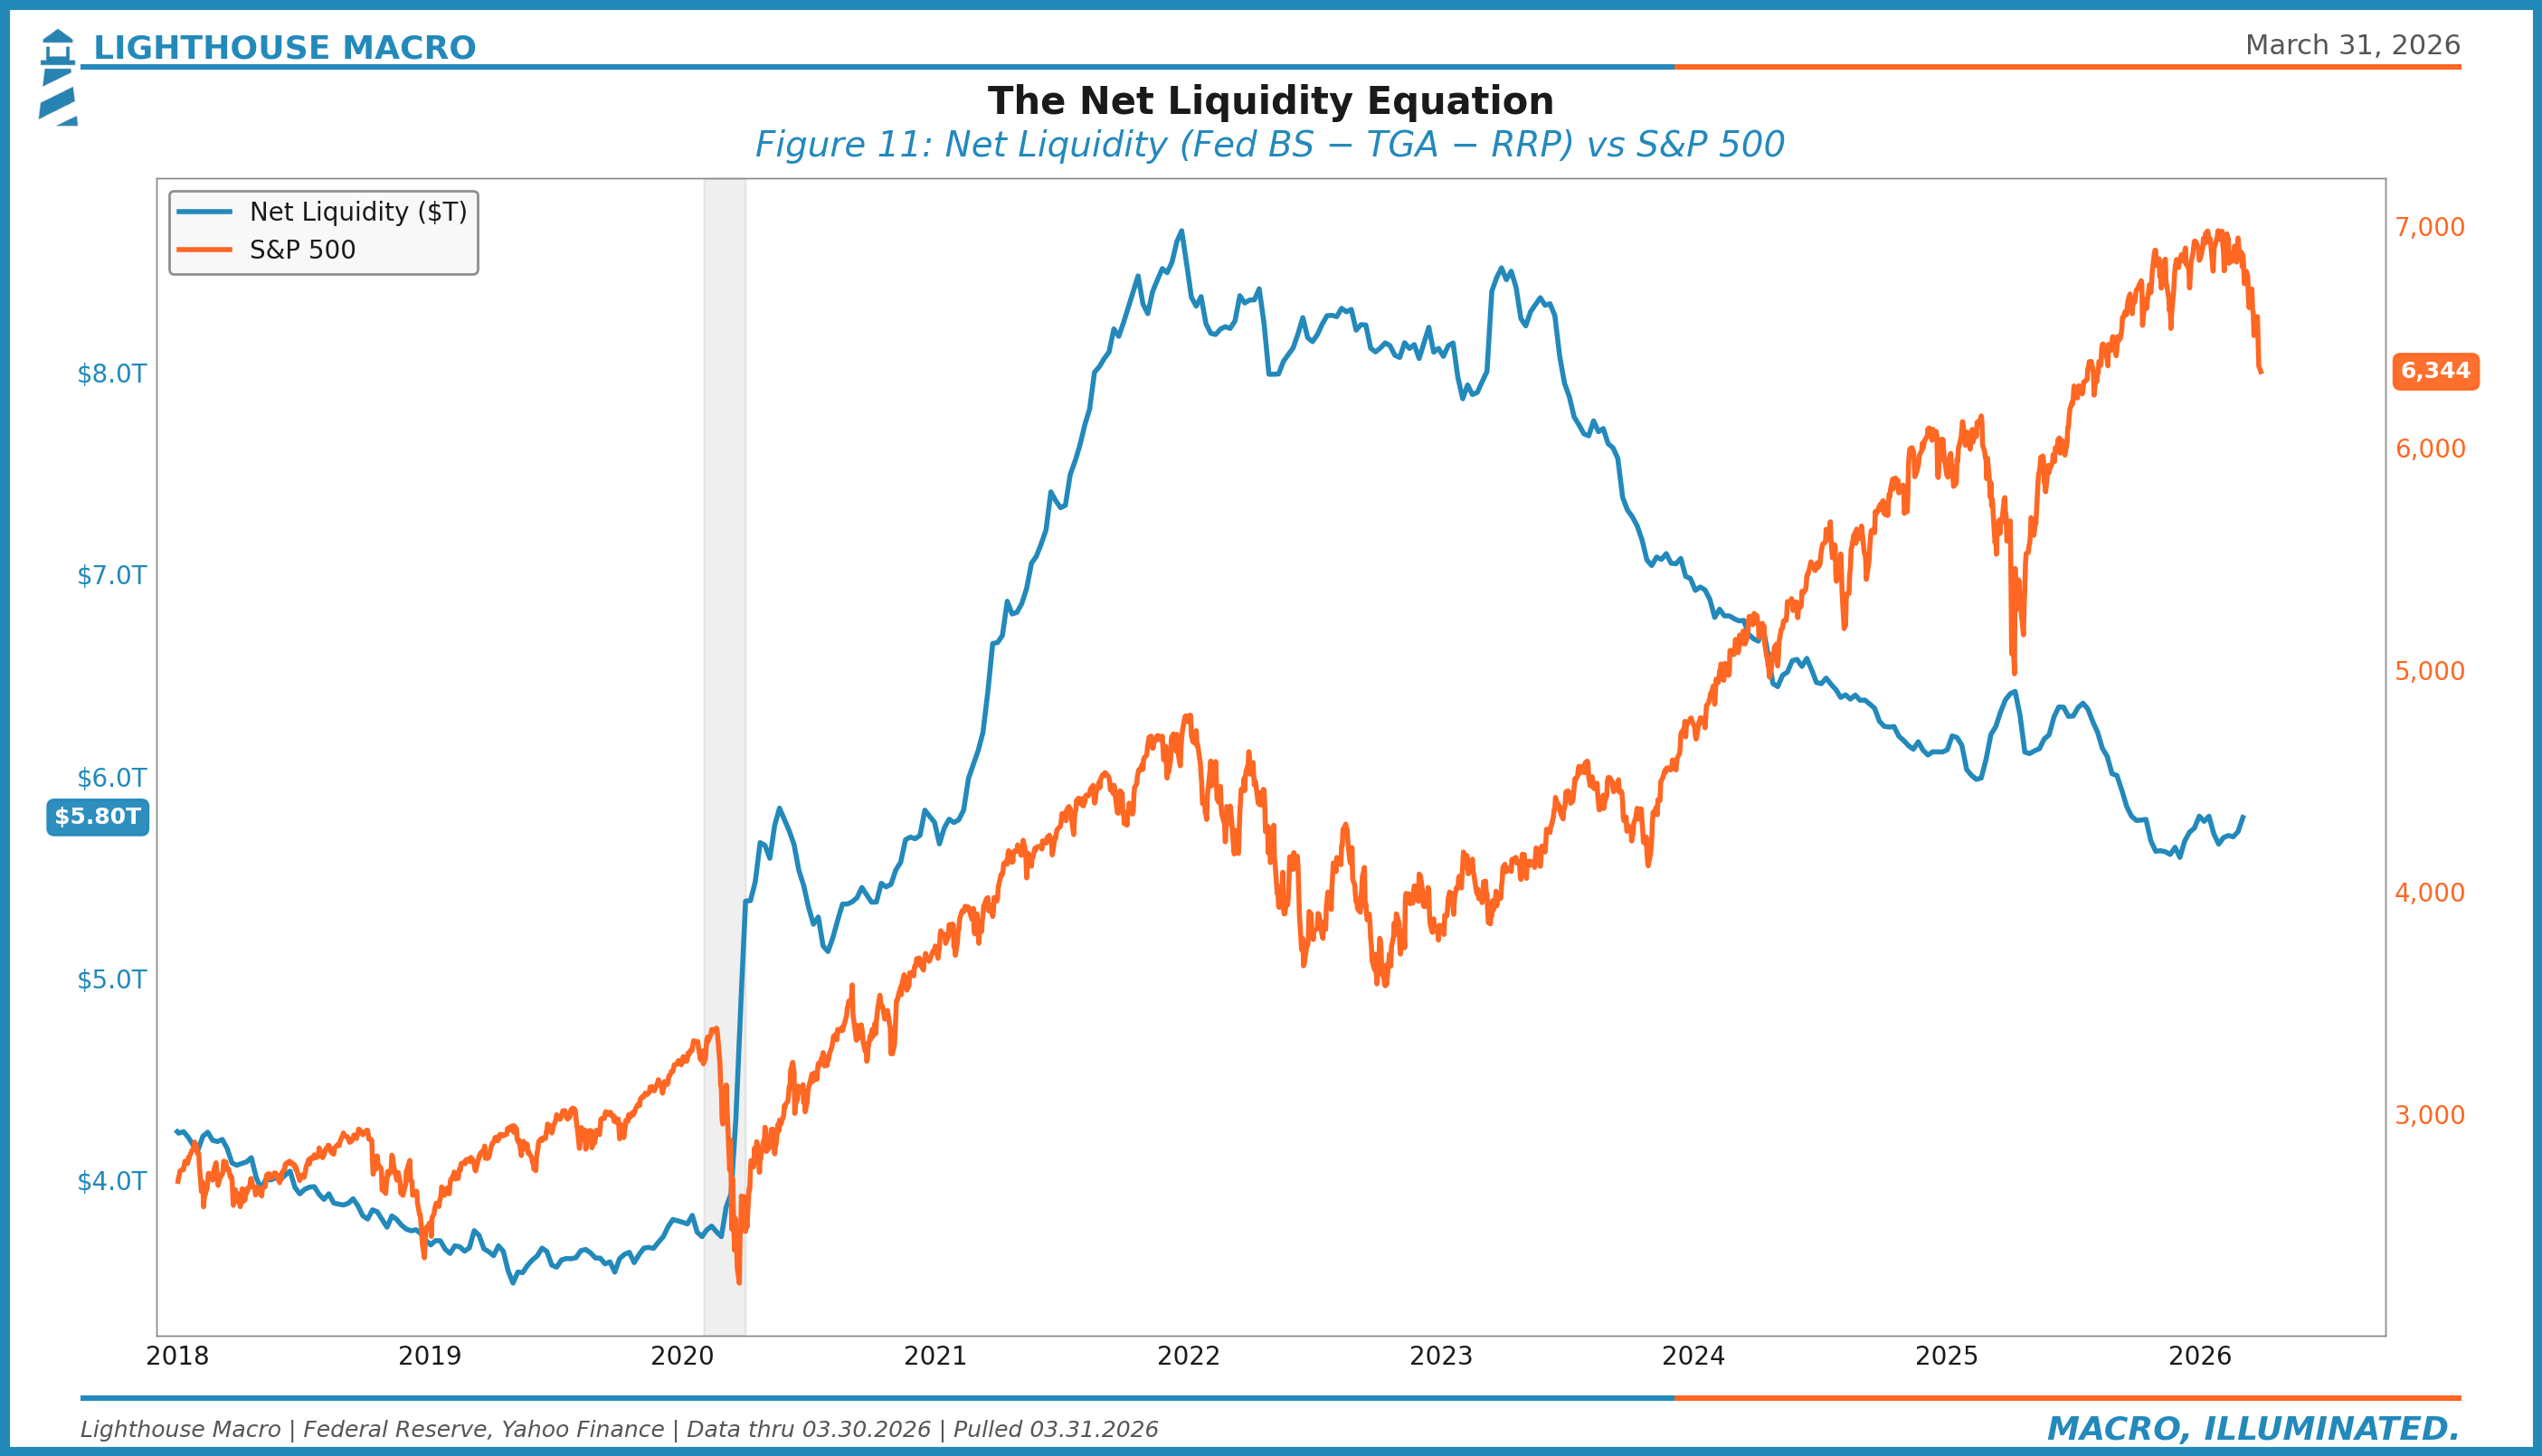
Net Liquidity (Fed balance sheet minus TGA minus RRP) has become the most widely followed plumbing metric, particularly in the crypto and macro-adjacent space. There’s a reason for that: it correlates with risk assets more cleanly than almost any single variable.
We include it here not because it’s the best measure of plumbing health (it isn’t, it’s too reductive), but because it captures the net flow of liquidity into the system in a single number. When Net Liquidity expands, risk assets tend to rally. When it contracts, they tend to struggle.
The limitation is that Net Liquidity treats all reserves equally. It doesn’t capture distribution, funding spreads, or the quality of collateral in the system. It’s a useful shorthand, not a diagnostic tool. Use it to set the direction. Use the other nine indicators to understand the mechanism.
12. SOFR Volume: The Plumbing Got Bigger
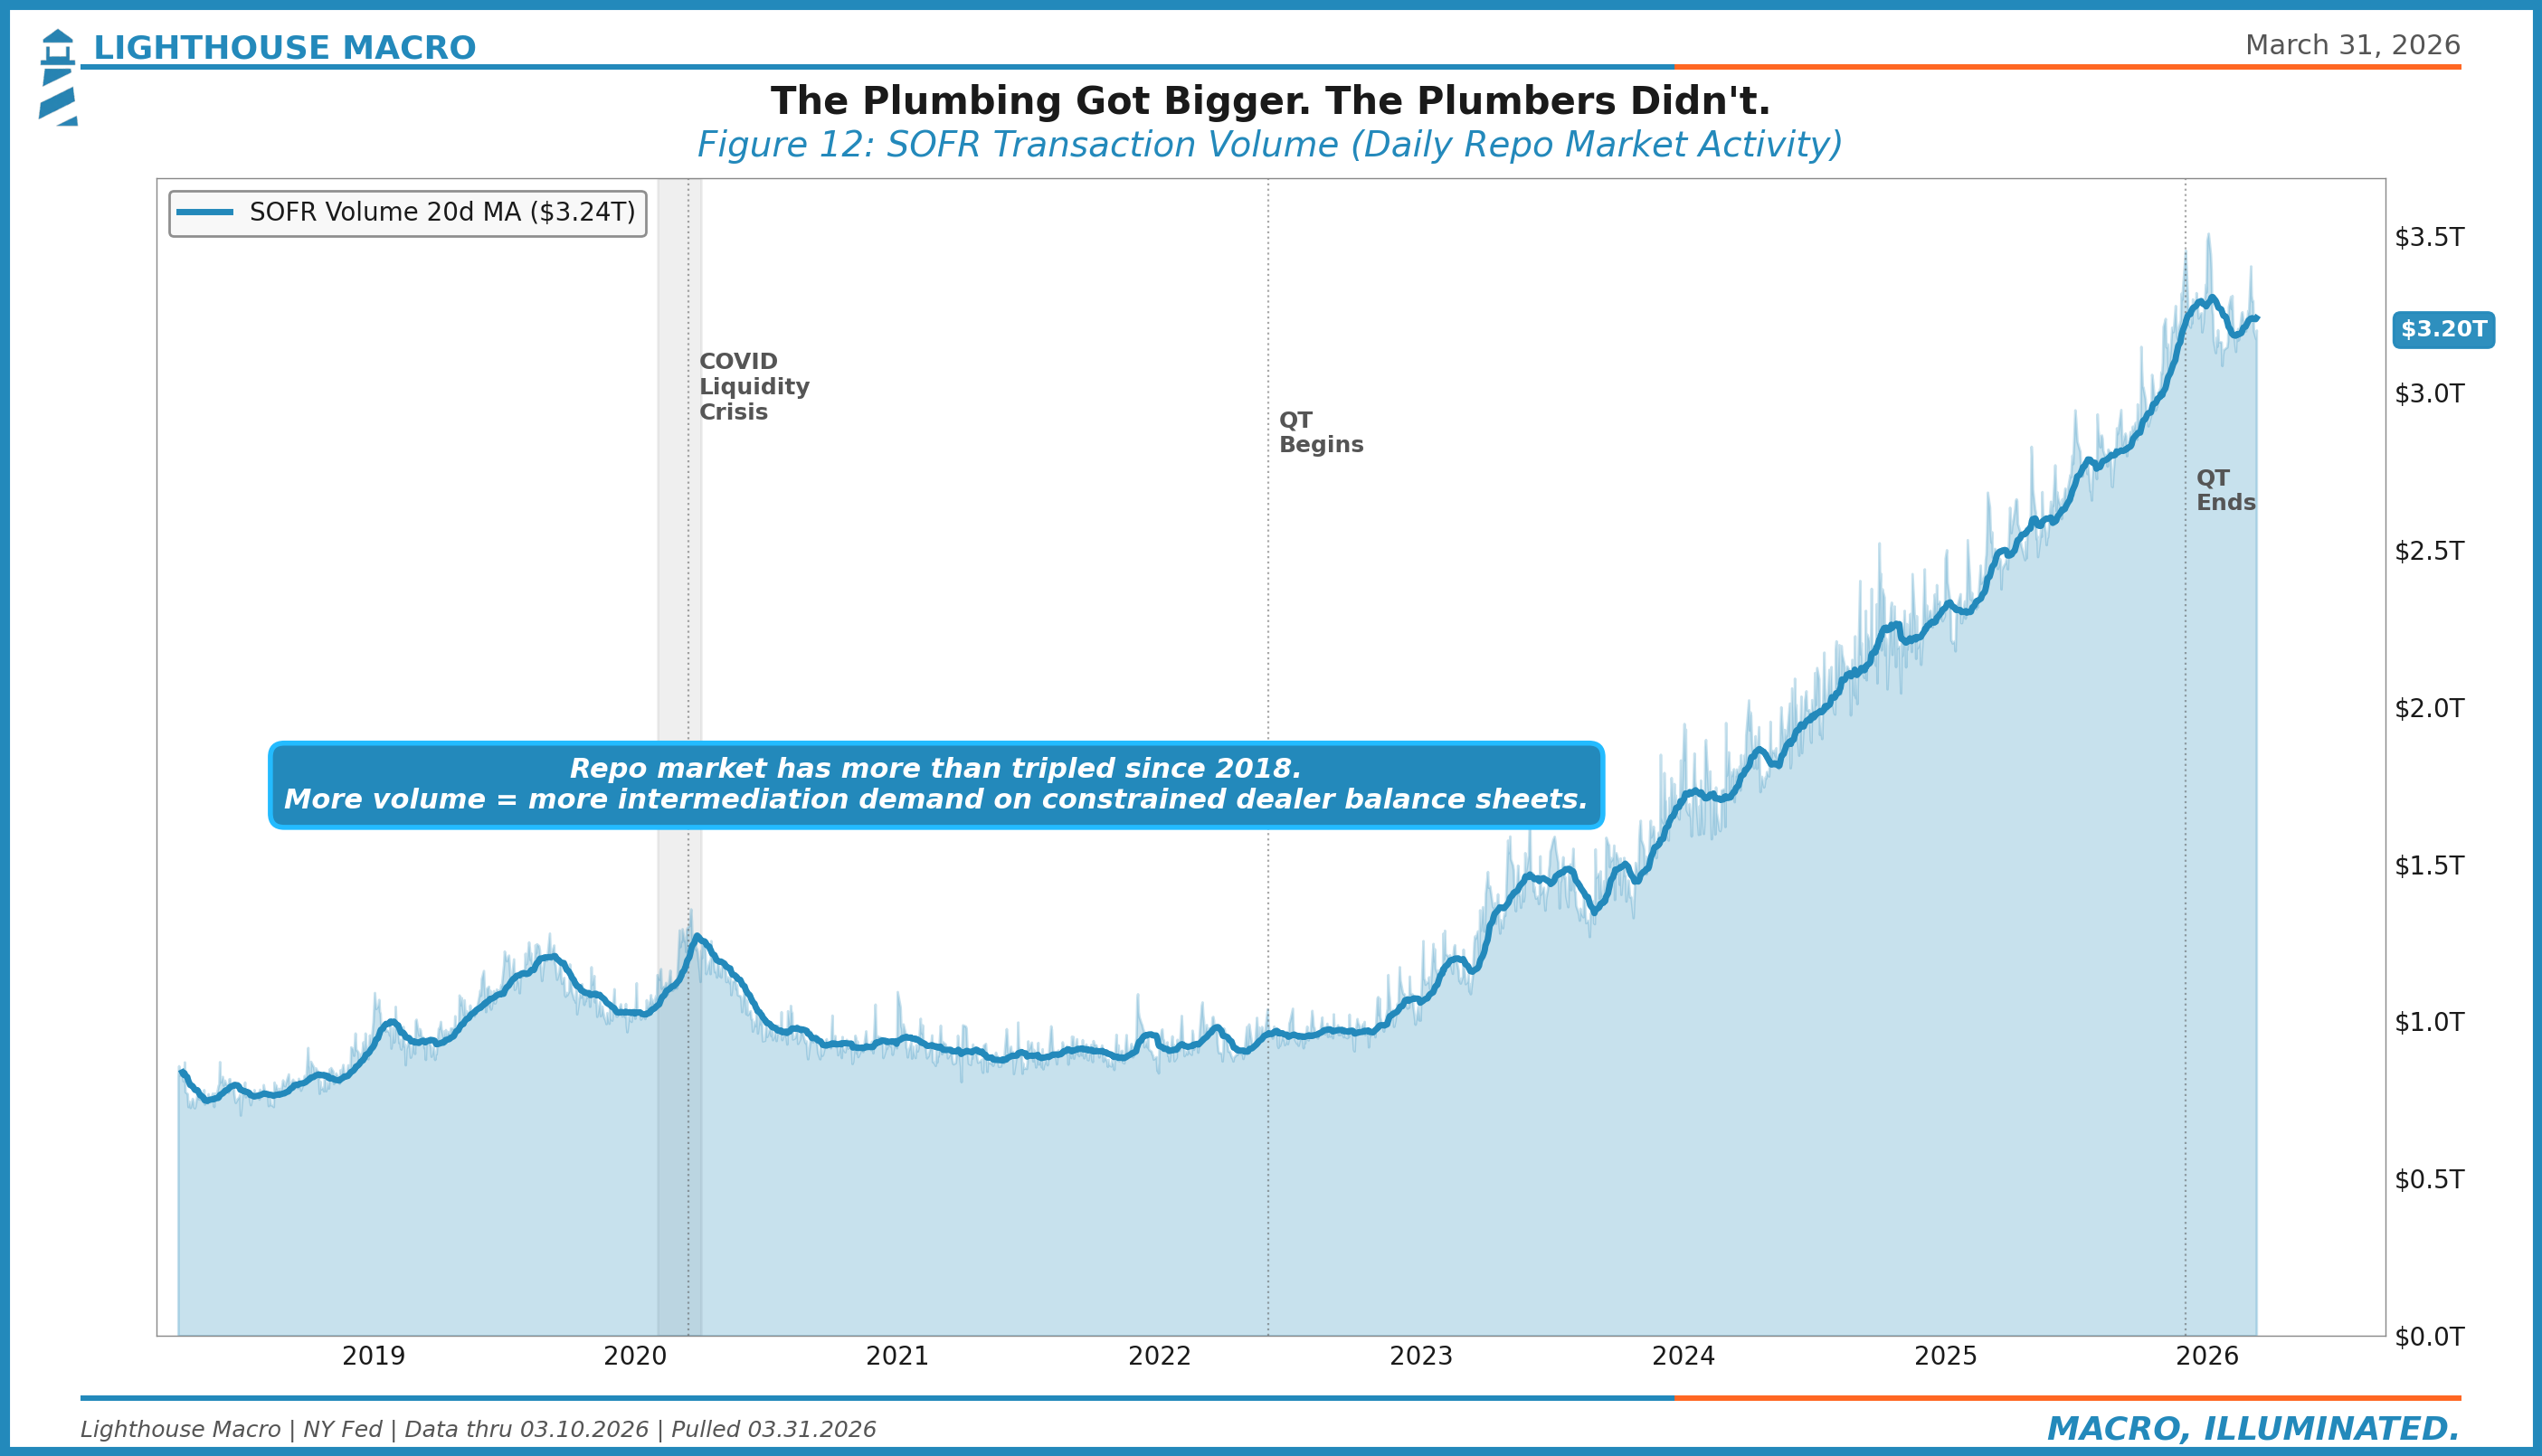
The previous eleven indicators measure the price of plumbing: spreads, rates, stress levels. This one measures the quantity. SOFR transaction volume captures the daily dollar amount flowing through the overnight repo market, the single largest short-term funding market in the world.
Since SOFR’s inception in 2018, daily repo volume has more than tripled, from roughly $700 billion to over $3.2 trillion. That growth reflects the expanding role of repo in the financial system: more Treasury issuance to finance, more hedge fund basis trades to roll, more money market funds investing in overnight paper.
The insight is structural: the plumbing got bigger, but the plumbers didn’t. Dealer balance sheet capacity hasn’t grown with the market. SLR and G-SIB constraints haven’t been relaxed. The same constrained dealers are intermediating three times the volume they were seven years ago. That’s why spread signals that were manageable at $1 trillion in daily volume become acute at $3 trillion. The system’s capacity to absorb shocks hasn’t scaled with the system itself.
The Consensus Traps
Trap 1: “The Fed Will Just Stop QT”
They did. In December 2025. But the lesson of September 2019 isn’t that the Fed can’t fix plumbing problems. It’s that the damage happens before the fix arrives.
In 2019, the Fed had been running QT for nearly two years. Multiple Fed officials had described the process as “like watching paint dry.” Two months before the repo blowout, reserve levels had breached a threshold nobody at the Fed had publicly identified. The standing response was to dismiss concerns. The system, they said, was flush.
The Fed learned from that episode. This time, they ended QT before the plumbing seized. But ending QT doesn’t eliminate scarcity risk. Reserves can still decline as non-reserve liabilities grow. The LCLOR is an estimate, not a bright line. And the system is structurally different now: more Treasury paper to intermediate, more constrained dealer balance sheets, no RRP buffer. The Fed stopped the active drain. The passive vulnerabilities remain.
Trap 2: “Reserves Are Still Abundant”
Maybe. But abundant for whom?
The aggregate reserve level obscures the distribution. The top four banks hold a disproportionate share of total reserves. Smaller banks, foreign banking organizations, and non-bank financial institutions face tighter conditions than the headline number implies.
This is the Sep 2019 lesson again. Total reserves were roughly $1.5 trillion, which the Fed considered sufficient. But the banks that needed overnight funding didn’t have reserves. The banks that had reserves didn’t need to lend. The aggregate was fine. The plumbing was not.
Today, reserves are higher in absolute terms. But the system is bigger, more complex, and more reliant on non-bank intermediation than it was in 2019. “Abundant” is relative to the plumbing, not to a dollar figure.
Trap 3: “The Basis Trade Is Fine Because It’s Been Fine”
The Treasury cash-futures basis trade is the quiet giant in the plumbing system. Hedge funds hold an estimated $1.85 trillion in Treasuries, financed overnight through repo, levered anywhere from 20x to as high as 50x or more, because the spread they’re capturing is tiny. They are functionally the marginal buyer of US government debt.
The consensus view treats this as benign: the trade has worked for years, the leverage is “well-managed,” and the Fed has backstop tools. But the risk isn’t the trade itself. It’s the funding mechanism. Every one of those positions needs to be rolled in repo, often overnight. When repo rates spike, the entire position goes from profitable to hemorrhaging in hours.
And here’s what makes the current setup more fragile than the last cycle: the G-SIB surcharge scores of the dealers who intermediate this paper are rising mechanically with the supply of “safe” assets. The more Treasuries the government issues, the higher the capital charge on the dealers who need to hold and intermediate them. Basel III Endgame, if implemented in anything close to its proposed form, would make this worse by increasing the risk-weighting for trading assets. The system is taxing its own plumbers at the exact moment it needs them most.
March 2020 showed what happens when the basis unwinds: forced Treasury selling, market dysfunction, and over $1 trillion in emergency Fed Treasury purchases within weeks. The position is bigger now. The buffer is smaller.
---
Where We Are Now (March 2026 Snapshot)
This section is a point-in-time read. The framework above is permanent. The numbers below will change.
Funding markets are calm. EFFR-IORB is well-behaved. SOFR is stable. The OFR Funding Stress Index isn’t flagging anything. If you looked at spreads alone, you’d conclude the system is fine.
And in some ways, it is. The Fed ended QT in December 2025, removing the mechanical drain that had been shrinking reserves for three and a half years. That was the lesson of 2019 applied in time (barely). Reserves sit at approximately $3.02 trillion, near the level the Fed considers the ample threshold.
But the structural vulnerabilities haven’t changed. RRP is effectively at zero. Dealer balance sheets remain constrained by SLR and G-SIB surcharges. The basis trade is larger than ever. And the October 2025 episode proved that the system doesn’t need a reserve crisis to produce a market event. It just needs a catalyst hitting a system with no buffer.
We’ve already seen what that looks like. October’s tariff shock triggered $19 billion in crypto liquidations. February’s event was smaller ($2.2 billion), but it happened in a system that had already absorbed the prior shocks without rebuilding any cushion.
Today is quarter-end. Balance sheet window dressing is in effect. If funding spreads stay contained through the first week of April, the system passed the test. If they don’t, the question becomes how quickly the Fed’s reserve management purchases can offset the pressure.
Cross-pillar context: Plumbing doesn’t exist in isolation. Government (Pillar 8) is flooding the system with $2T+ in annual issuance that dealers must absorb. Financial conditions (Pillar 9) show credit spreads tight but vulnerable to a plumbing shock. The broader macro picture (SPY below its 200-day, VIX elevated, exogenous geopolitical stress) narrows the margin for error on every front simultaneously. Plumbing is the connective tissue. When it tightens, every other pillar feels it.
How to Track This
Daily: EFFR and SOFR (NY Fed, published next morning), RRP usage (NY Fed), OFR FSI
Weekly: Bank reserves (H.4.1 release, every Thursday at 4:30 PM ET), TGA balance (H.4.1), dealer net Treasury positioning (NY Fed primary dealer data)
Monthly: Money market fund assets (OFR/ICI), commercial paper outstanding and rates, hedge fund repo borrowing
Mark your calendar: Tax payment dates (April 15, June 15, September 15, December 15) and quarter-ends (March 31, June 30, September 30, December 31) are the predictable stress points. These are the dates when reserves drain (taxes), balance sheets shrink (window dressing), and funding spreads spike mechanically. Elevated prints on those dates are normal. Prints that stay elevated for three or more days afterward are not.
The spread hierarchy to watch (in order of urgency):
EFFR-IORB above +8 bps on a non-quarter-end date = reserves scarce
SOFR-IORB above +10 bps sustained = repo market stress
SOFR above EFFR (positive spread) = dealer balance sheet is the binding constraint, not cash
GCF-TPR above +20 bps = dealer intermediation capacity exhausted
SRF take-up above $5 billion = system hitting the ceiling
Invalidation Criteria
Bullish case (plumbing improves): The Fed’s reserve management purchases successfully maintain reserves above the ample threshold. EFFR-IORB remains stable. Funding spreads stay compressed through quarter-ends. The standing repo facility proves effective as a backstop without ever being used at scale.
Bearish case (plumbing deteriorates): Reserves breach the low end of the LCLOR range. EFFR-IORB spikes above +8 bps on a non-quarter-end date. SOFR prints persistently above IORB. SOFR-EFFR stays positive and widening (dealer capacity shrinking). CP spreads widen without an obvious credit catalyst. The basis trade unwinds, forcing hedge fund Treasury selling. The Fed is forced to intervene with emergency operations.
If the first set happens, the plumbing pillar shifts to “supportive,” and the urgency of monitoring these signals decreases. If the second set happens, Pillar 10 becomes the most important pillar in the framework, because plumbing stress propagates through the system faster than any other channel.
Bottom Line
The plumbing of the financial system is invisible by design. Reserves flow. Repo markets clear. Funding spreads stay tight. Until they don’t.
September 2019 proved that plumbing failures don’t need a recession to trigger them. October 2025 proved that plumbing stress doesn’t stay in the plumbing. It cascades: reserves drain, funding costs spike, dealer capacity shrinks, leverage unwinds, and the most fragile assets break first.
The RRP cushion that protected the system for three years is at zero. Reserves sit near the level the Fed considers the ample threshold. The Fed ended QT in December 2025, but the structural vulnerabilities remain. Dealer balance sheets are constrained by the same regulatory architecture (SLR, G-SIB surcharges) that’s supposed to make the system safer. And the basis trade, the largest levered position in Treasuries in history, is financed overnight through the exact repo market we’ve been tracking.
There are excellent analysts who map this plumbing in granular detail. Our edge isn’t competing with them on the mechanics. It’s connecting the plumbing to the other 11 pillars. When labor fragility is rising (Pillar 1) and credit spreads are tight (Pillar 9) and the government is issuing $2 trillion a year (Pillar 8) and dealer capacity is constrained (this pillar), that’s not four separate observations. That’s one system under stress from multiple directions simultaneously. The plumbing is where the stress surfaces first.
Watch the spreads. Track the reserves. Respect the plumbing.
Macro, Illuminated.
This is the tenth installment of the Diagnostic Dozen, a 12-part series walking through every pillar of the Lighthouse Macro framework. Up next: Pillar 11, Market Structure.
Don’t navigate in the dark. Join The Watch.
Bob Sheehan, CFA, CMT | Founder & Chief Investment Officer
Lighthouse Macro | LighthouseMacro.com | @LHMacro