Narrow at the Highs
The Beam · August 14, 2026

Happy Friday. One quick thing before the note.
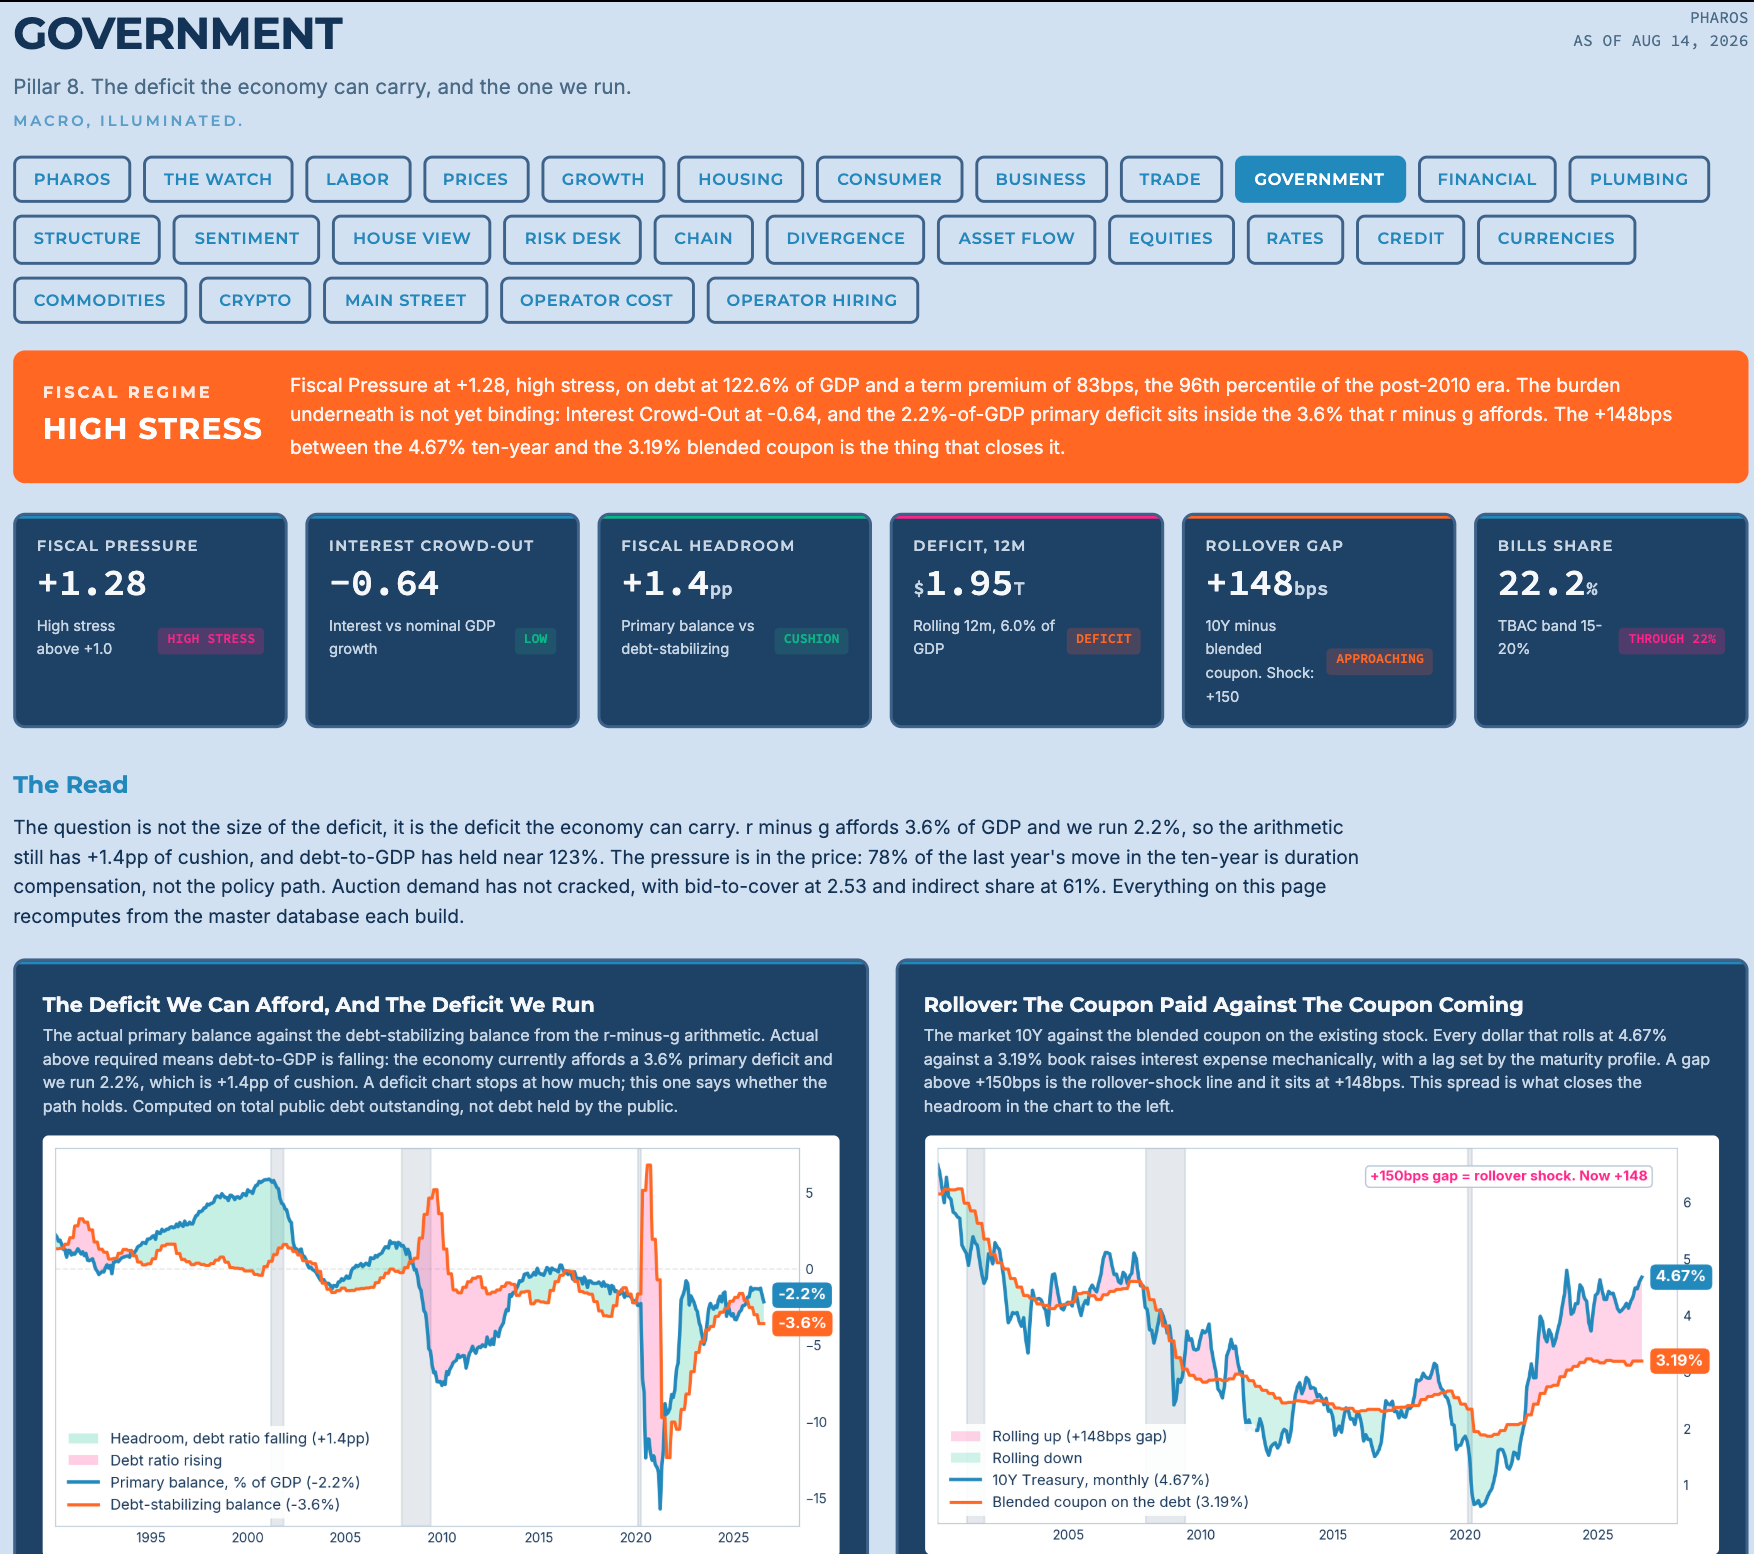
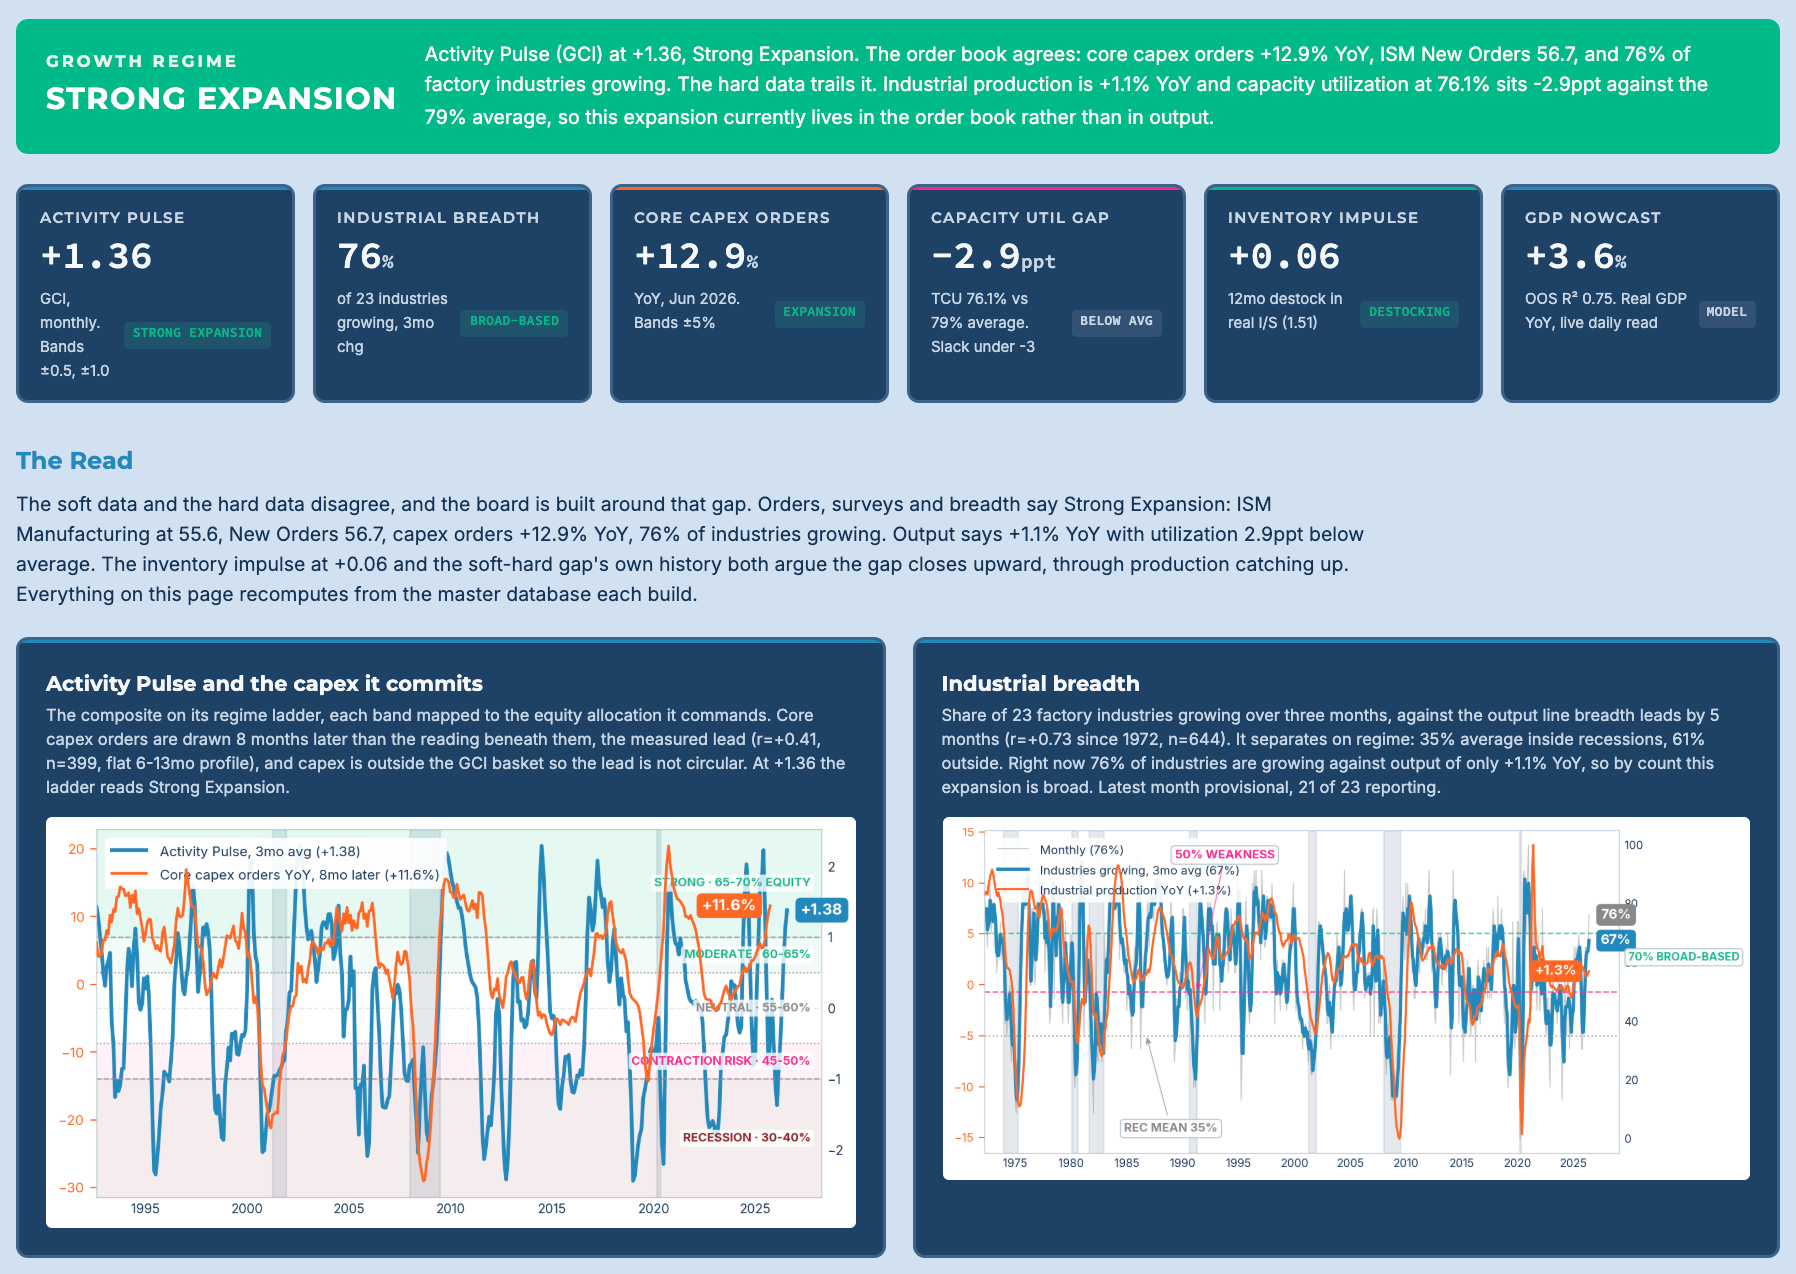
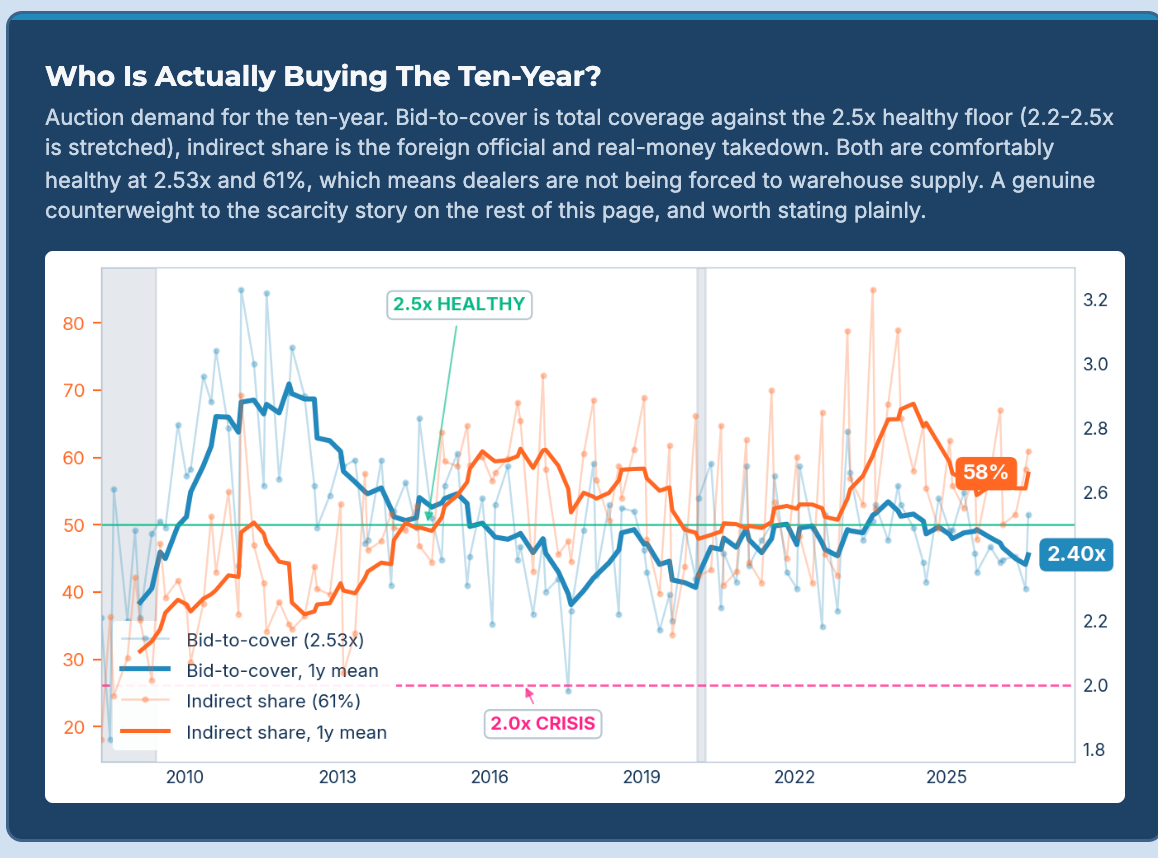
We have been heads down on Pharos for weeks now and the build has outgrown where it started. Twenty-seven dashboards. Twelve pillars, six asset classes, six transmission chains, and three Main Street monitors, and the coverage getting wider is only half of it, because every dashboard itself got rebuilt in the process. The indicators inside them are ours and we are fairly confident you will not find them anywhere else, but unique was never the goal. Diagnosing the economy accurately and efficiently is. Which means a pillar does not get the same six charts every time. It gets the best six for what is happening right now.
At the bottom of the Pharos homepage we added a 60-page indicator reference guide, downloadable as a PDF. Components, transformations, and what each indicator is actually trying to measure. The specific weights and formulas stay ours.
Paid subscribers sign in at pharos.lighthousemacro.com with your subscription email. Anything unclear, just reply to this one and ask.
Don’t navigate in the dark. Join the Watch.
A look at what is inside.
The Setup
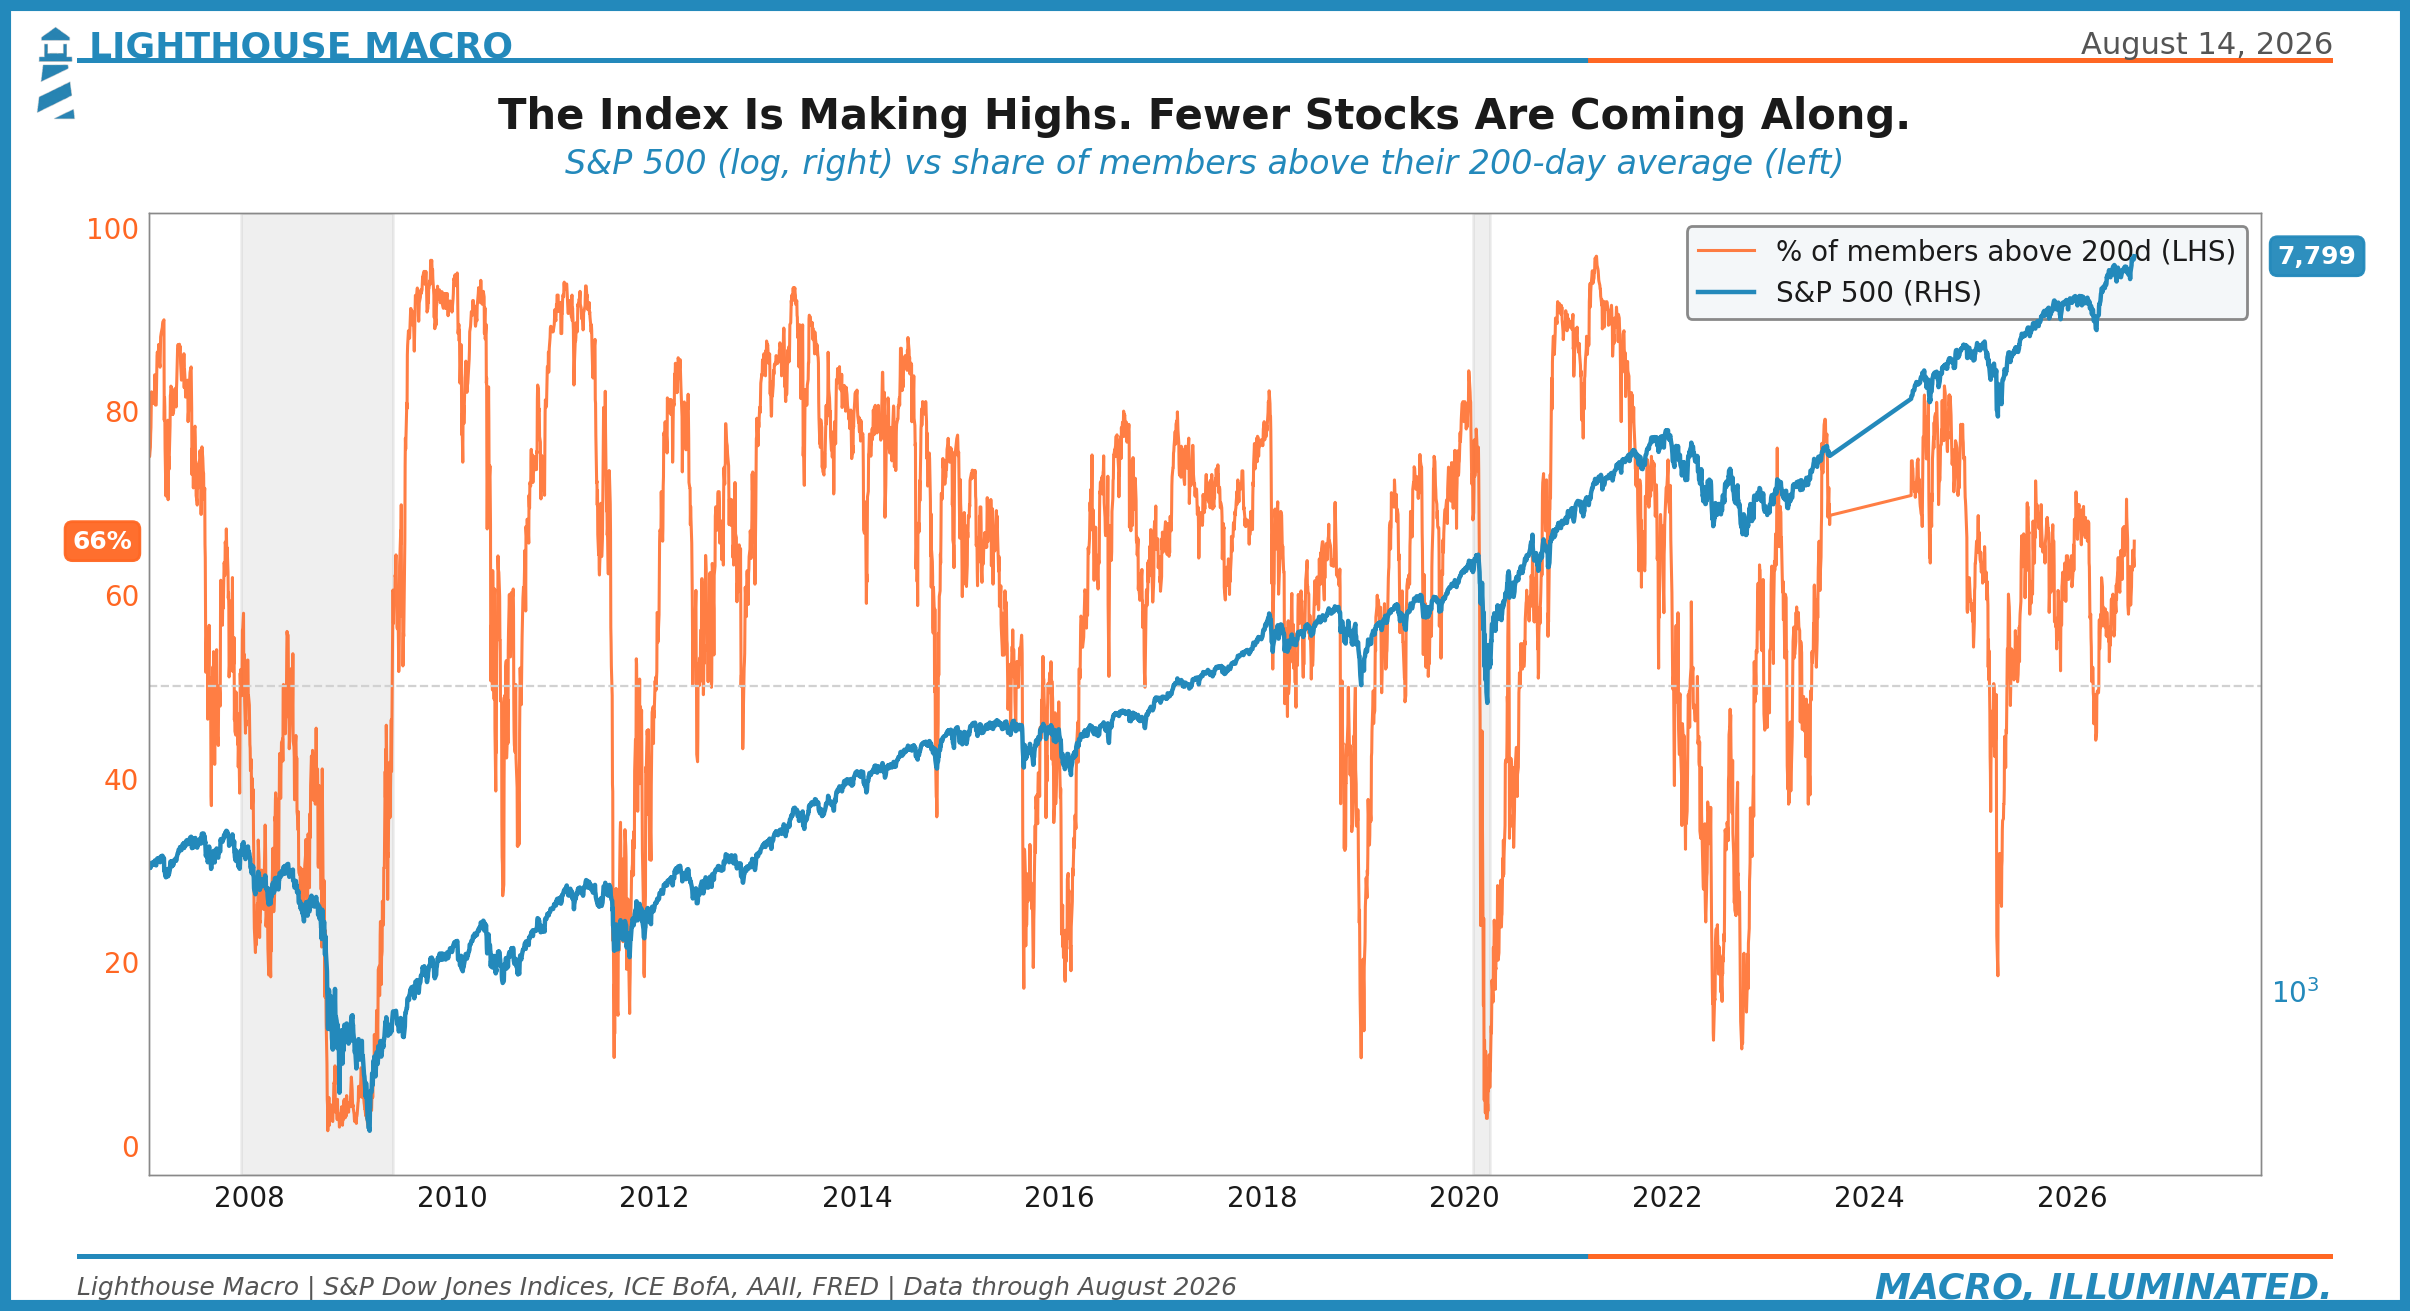
The S&P 500 closed Wednesday at 7,798.99, ten percent above its own 200-day average, with a 14-day RSI of 76.7. That is a strong tape by any reading. It is also a thinner one than the price suggests. Over the same 21 sessions that the index added 226 points, the share of members above their 200-day averages fell almost a point to 65.8%, and the share above their 50-days slipped to 60.6%. The index kept climbing. Fewer stocks came along.
That combination has a name in every technician's handbook. Narrowing participation at new highs is distribution. The generals advance, the soldiers fall back, and the tape rolls over some weeks later. It is one of the oldest warnings in the business, and it is flashing right now.
We went and checked whether it actually works. That is the piece.