

Market Structure: The Weight of Evidence
Diagnostic Dozen, Pillar 11 of 12

On Wednesday, the S&P 500 ripped 2.51% on a ceasefire headline, its best day since April 2025. On Thursday, it tacked on another 0.62% to close at 6,824. Seven straight days up. The longest winning streak since October. The index reclaimed both its 50-day and 200-day moving averages in 48 hours. Social media lit up. “The bottom is in.”
Maybe. But reclaiming a moving average on a news-driven gap is not the same as confirming a structural recovery. The weight of evidence has more to say.
Price is one data point. Market structure is the full picture. It tells you whether a rally has legs or whether the generals are charging ahead without soldiers. It tells you when a selloff is overdone and when it’s just getting started. It’s the difference between a regime shift and a relief rally.
This is the pillar that separates the signal from the noise.
• • •
Core Insight: Breadth Is the Truth Serum
Most investors watch price. The S&P 500 is up, so the market is healthy. The S&P 500 is down, so it’s not. That framing is dangerously incomplete.
The S&P 500 is a market-cap-weighted index. A handful of mega-cap names can drag it in either direction while the median stock tells a completely different story. We saw this throughout 2024 and into early 2025: the index made new highs while participation narrowed, breadth deteriorated, and the average stock quietly rolled over.
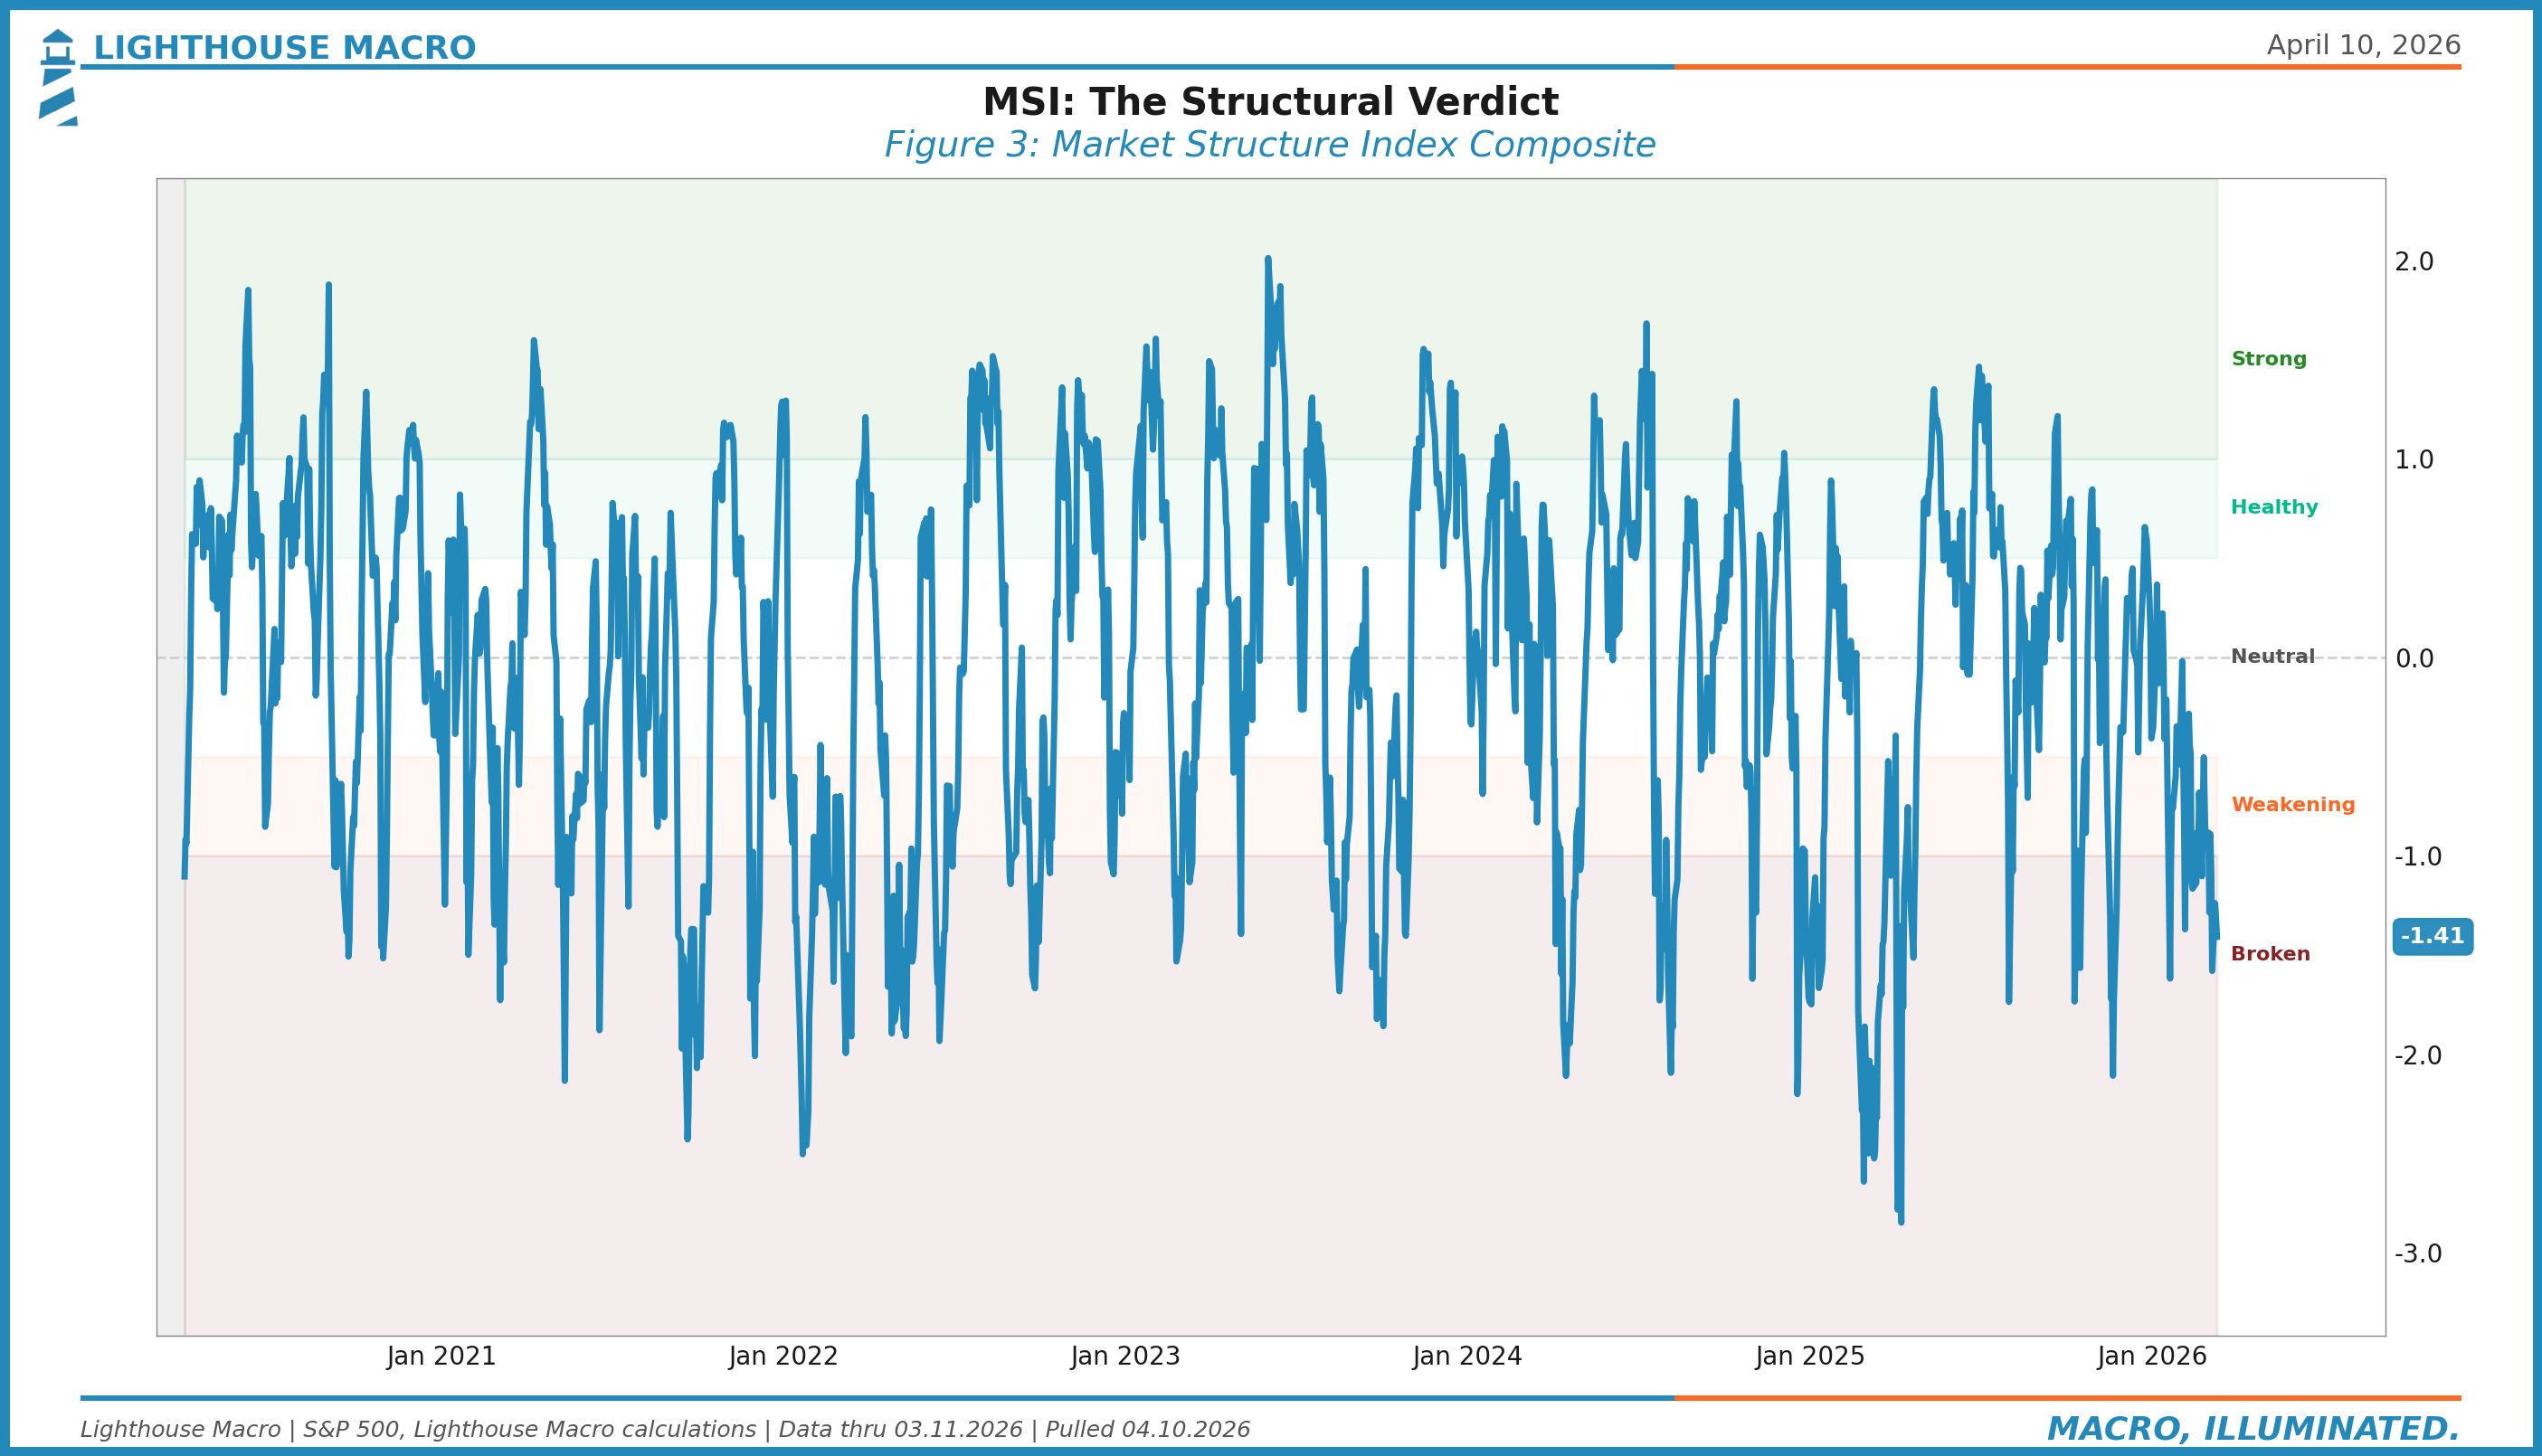
Market structure captures what price alone cannot. It synthesizes trend, momentum, breadth, and internal health into a single composite. When all four align, the signal is strong. When they diverge, something is breaking beneath the surface.
Our framework rests on a simple hierarchy:
Trend tells you where you are. Is price above or below the 200-day moving average? Is the 50-day rising or falling? These are slow signals. They don’t change often, and when they do, it matters.
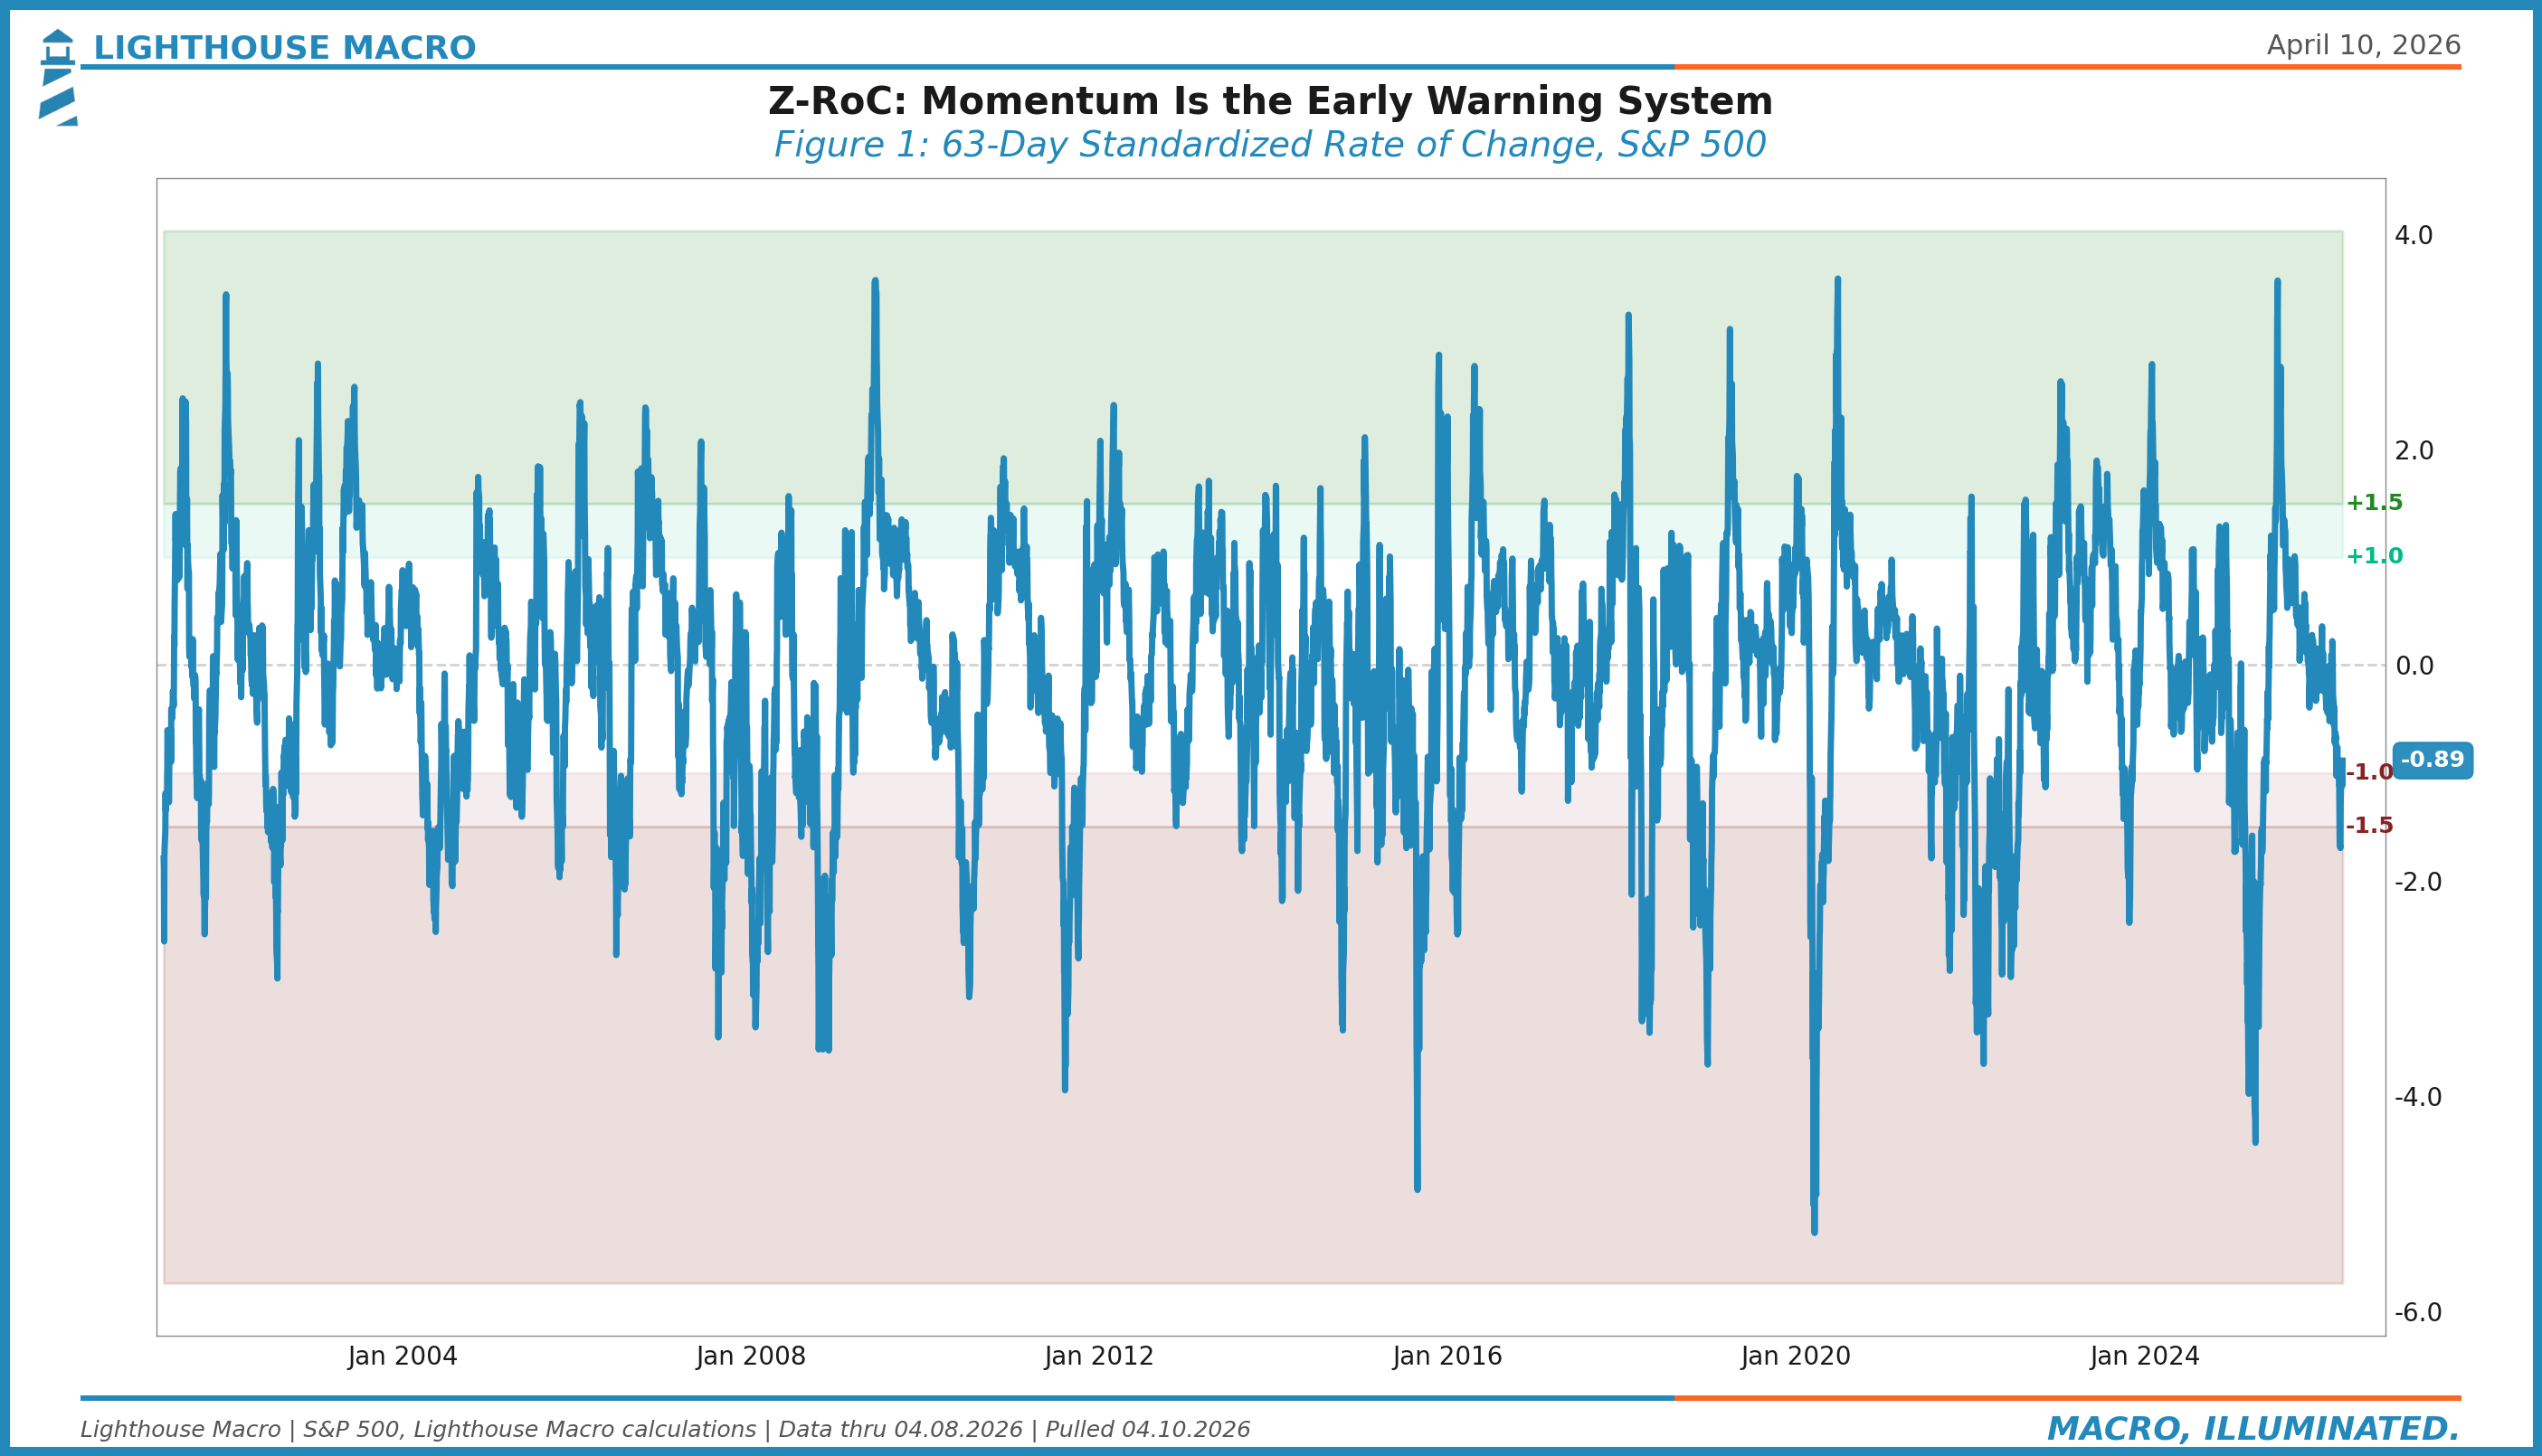
Momentum tells you how fast things are changing. Our Z-Rate of Change (Z-RoC) measures the standardized velocity of price movement across multiple timeframes. Momentum leads price. When it breaks first, the trend usually follows.
Breadth tells you who’s participating. The percentage of stocks above their 50-day and 200-day moving averages, the advance-decline line, new highs minus new lows. A rising index on narrowing breadth is a warning. A rising index on expanding breadth is confirmation.
Together, these three dimensions form the Market Structure Index.
• • •
What to Watch: The Market Structure Index (MSI)
The MSI is an 11-component composite that synthesizes trend, momentum, and breadth into a single z-score. Each component is standardized against its own history, then weighted by its empirical contribution to forward equity returns.
Here’s the architecture:
Trend Components
Price vs. 200-day MA: The primary trend signal. Above = bull, below = bear. Simple, but it matters more than most things people complicate.
Price vs. 50-day MA : The intermediate trend. Faster signal, more noise, but useful for identifying transitions.
50-day MA Slope: Is the intermediate trend accelerating or decelerating? Direction of the slope matters as much as the level.
Momentum Components
20-day MA Slope: Short-term directional signal. First to turn at inflection points.
Z-RoC, 63-day: The core momentum measure. This is the 3-month standardized rate of change. Below -1.0, momentum is broken. Above +1.0, it’s strong. At extremes beyond +/-1.5, mean reversion risk rises.
Breadth Components
This is the largest allocation, and intentionally so. Breadth is the most honest signal in the market.
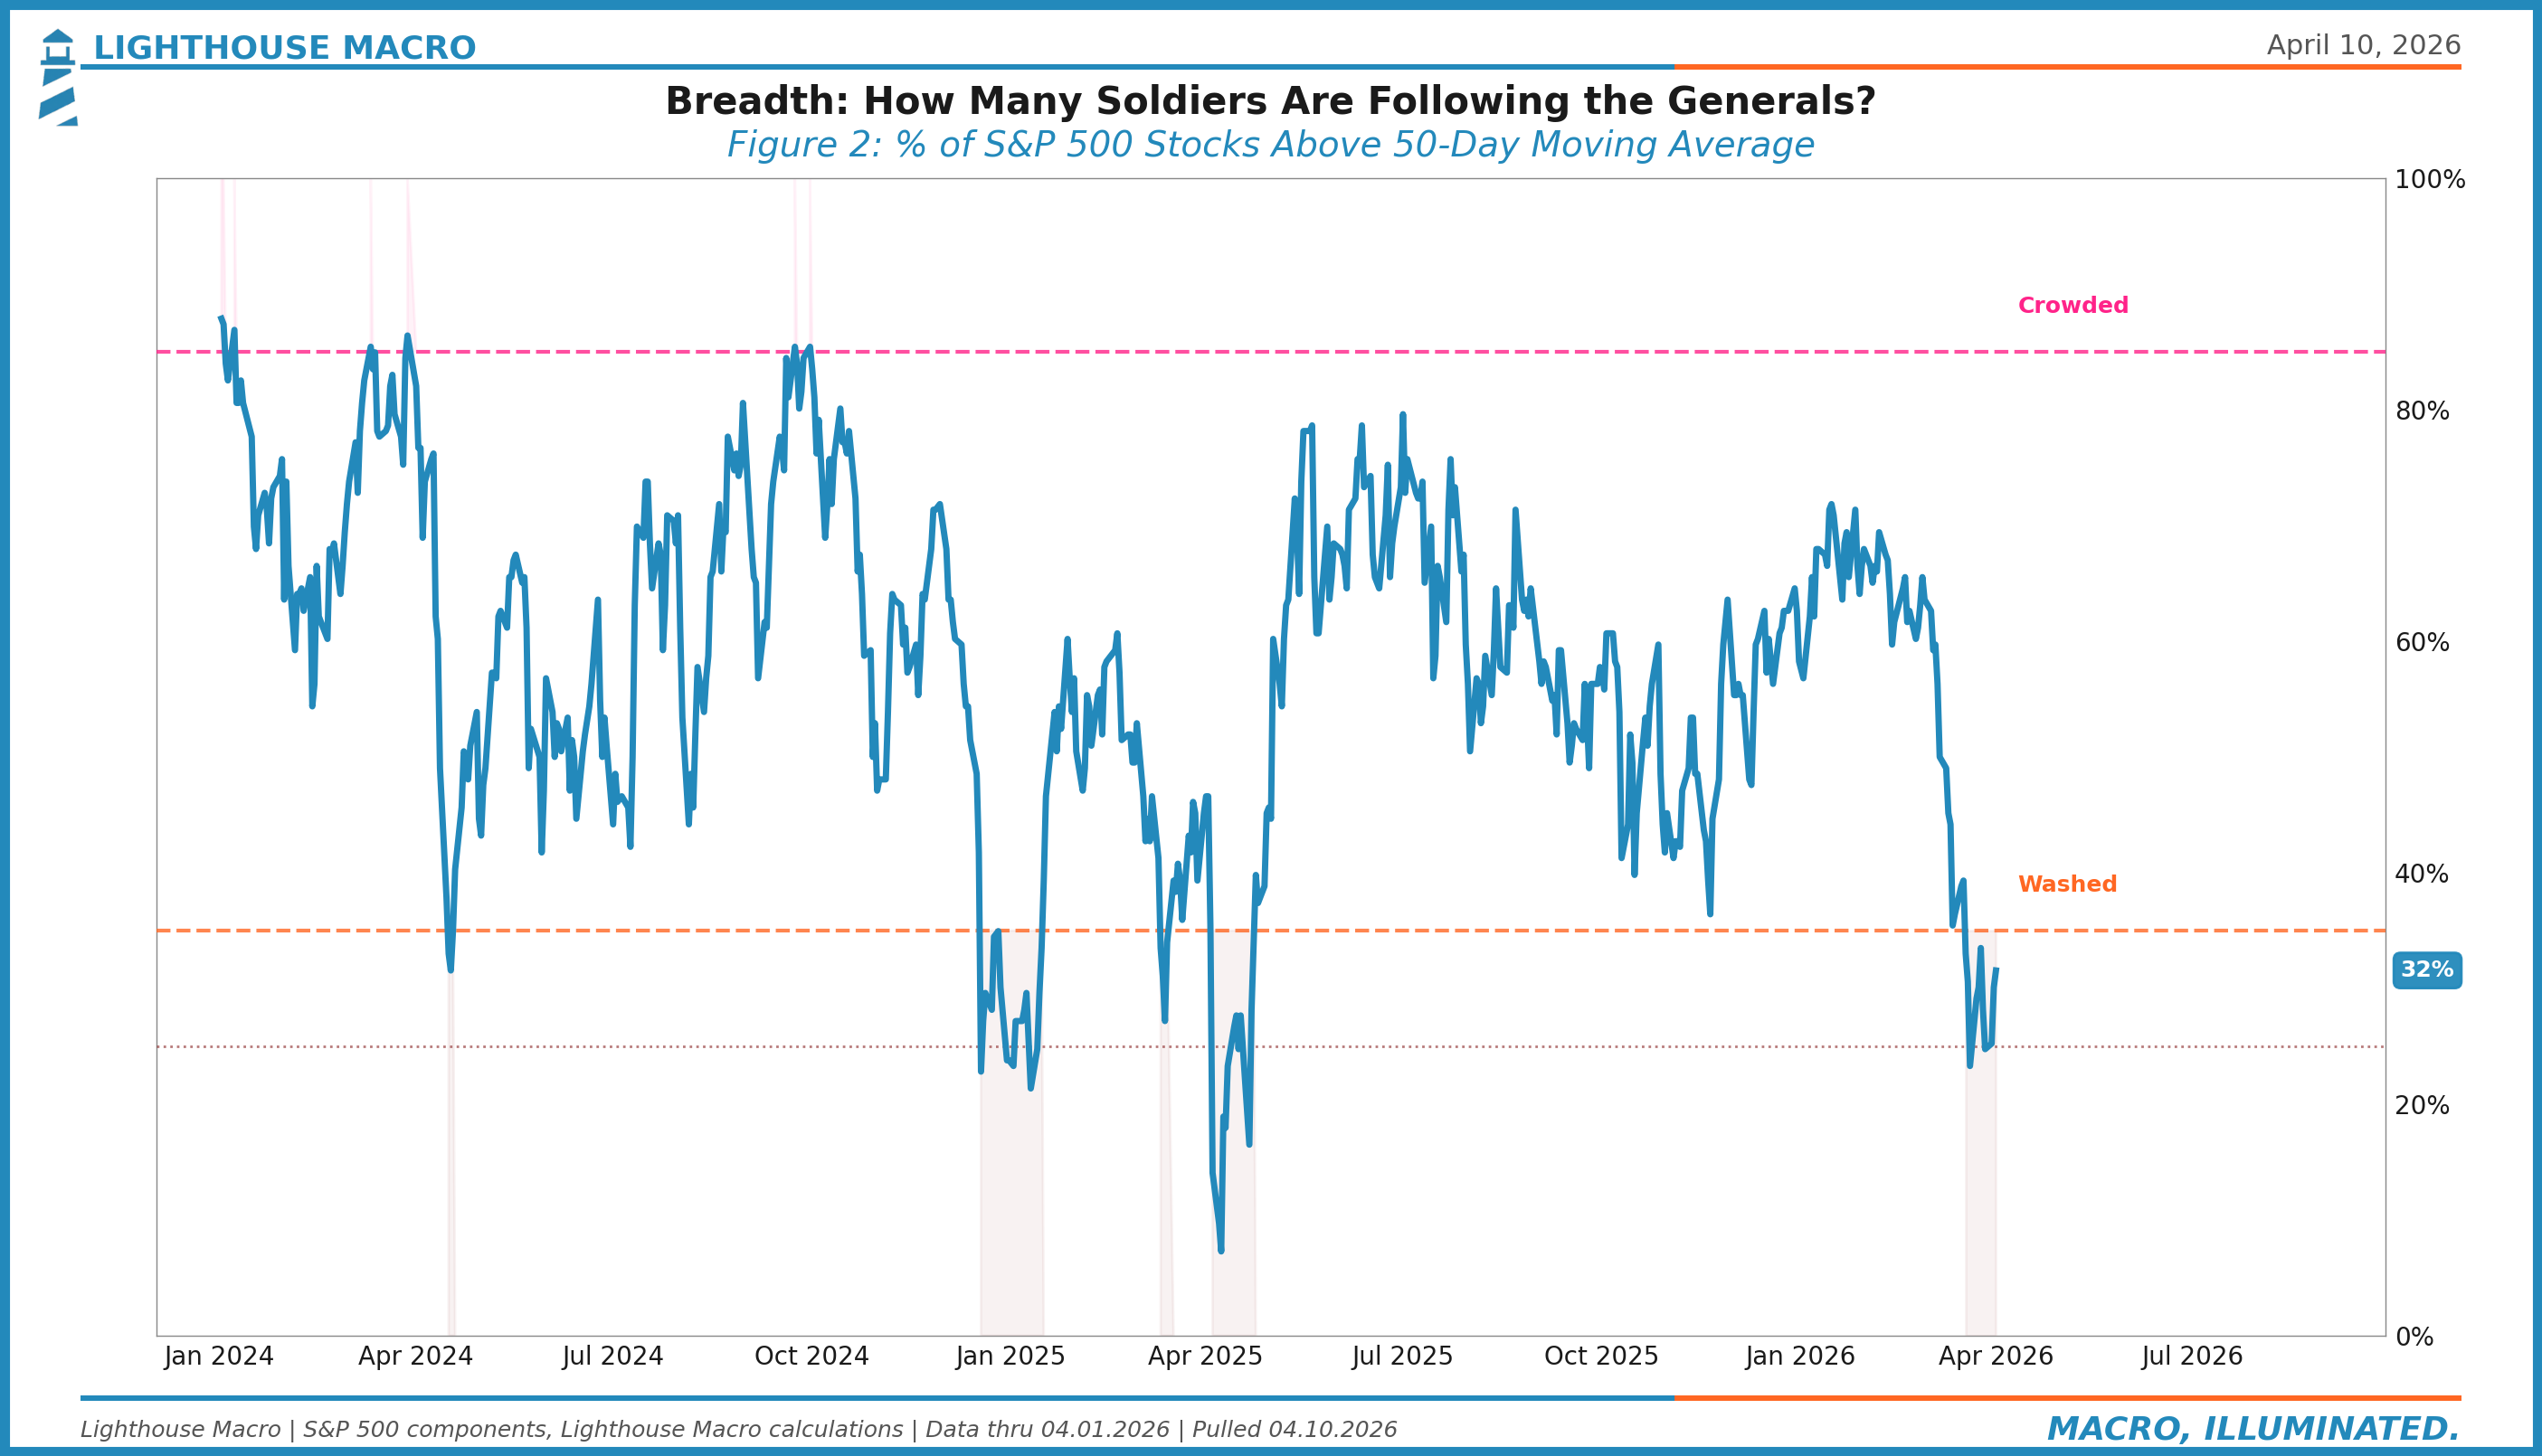
% Above 50-day MA: The participation rate at the intermediate level. Below 35% = washed. Above 85% = crowded. The thrust zone (30% to 70% in 10 sessions) is one of the most reliable buy signals in equity markets.
% Above 20-day MA: Short-term participation. More volatile, but useful at extremes. Below 25% = deeply oversold. Above 80% = stretched.
% Above 200-day MA: Long-term health. When this falls below 50%, the majority of stocks are in downtrends regardless of what the index says.
New Highs minus New Lows, 20-day MA: The rate of new extremes. When new lows dominate, the damage is broad. When new highs dominate, the advance is healthy.
Advance-Decline Line Slope: The cumulative flow of advancing vs. declining issues. Divergences from price are classic distribution signals.
Additional Components
McClellan Summation Index: A smoothed breadth oscillator derived from the advance-decline differential. Captures the medium-term trend of market internals.
The Indicators
Price vs. 200-Day Moving Average
This is the simplest and most important signal in market structure. When the S&P 500 is above its 200-day moving average, the primary trend is up. When it’s below, it’s down. Full stop.
The nuance is in the transitions. The first break below the 200-day in a bull market isn’t necessarily the end. It’s a yellow flag. But if price stays below for more than 2-3 weeks and the 200-day itself starts to flatten or roll, the probability of a deeper correction rises sharply.
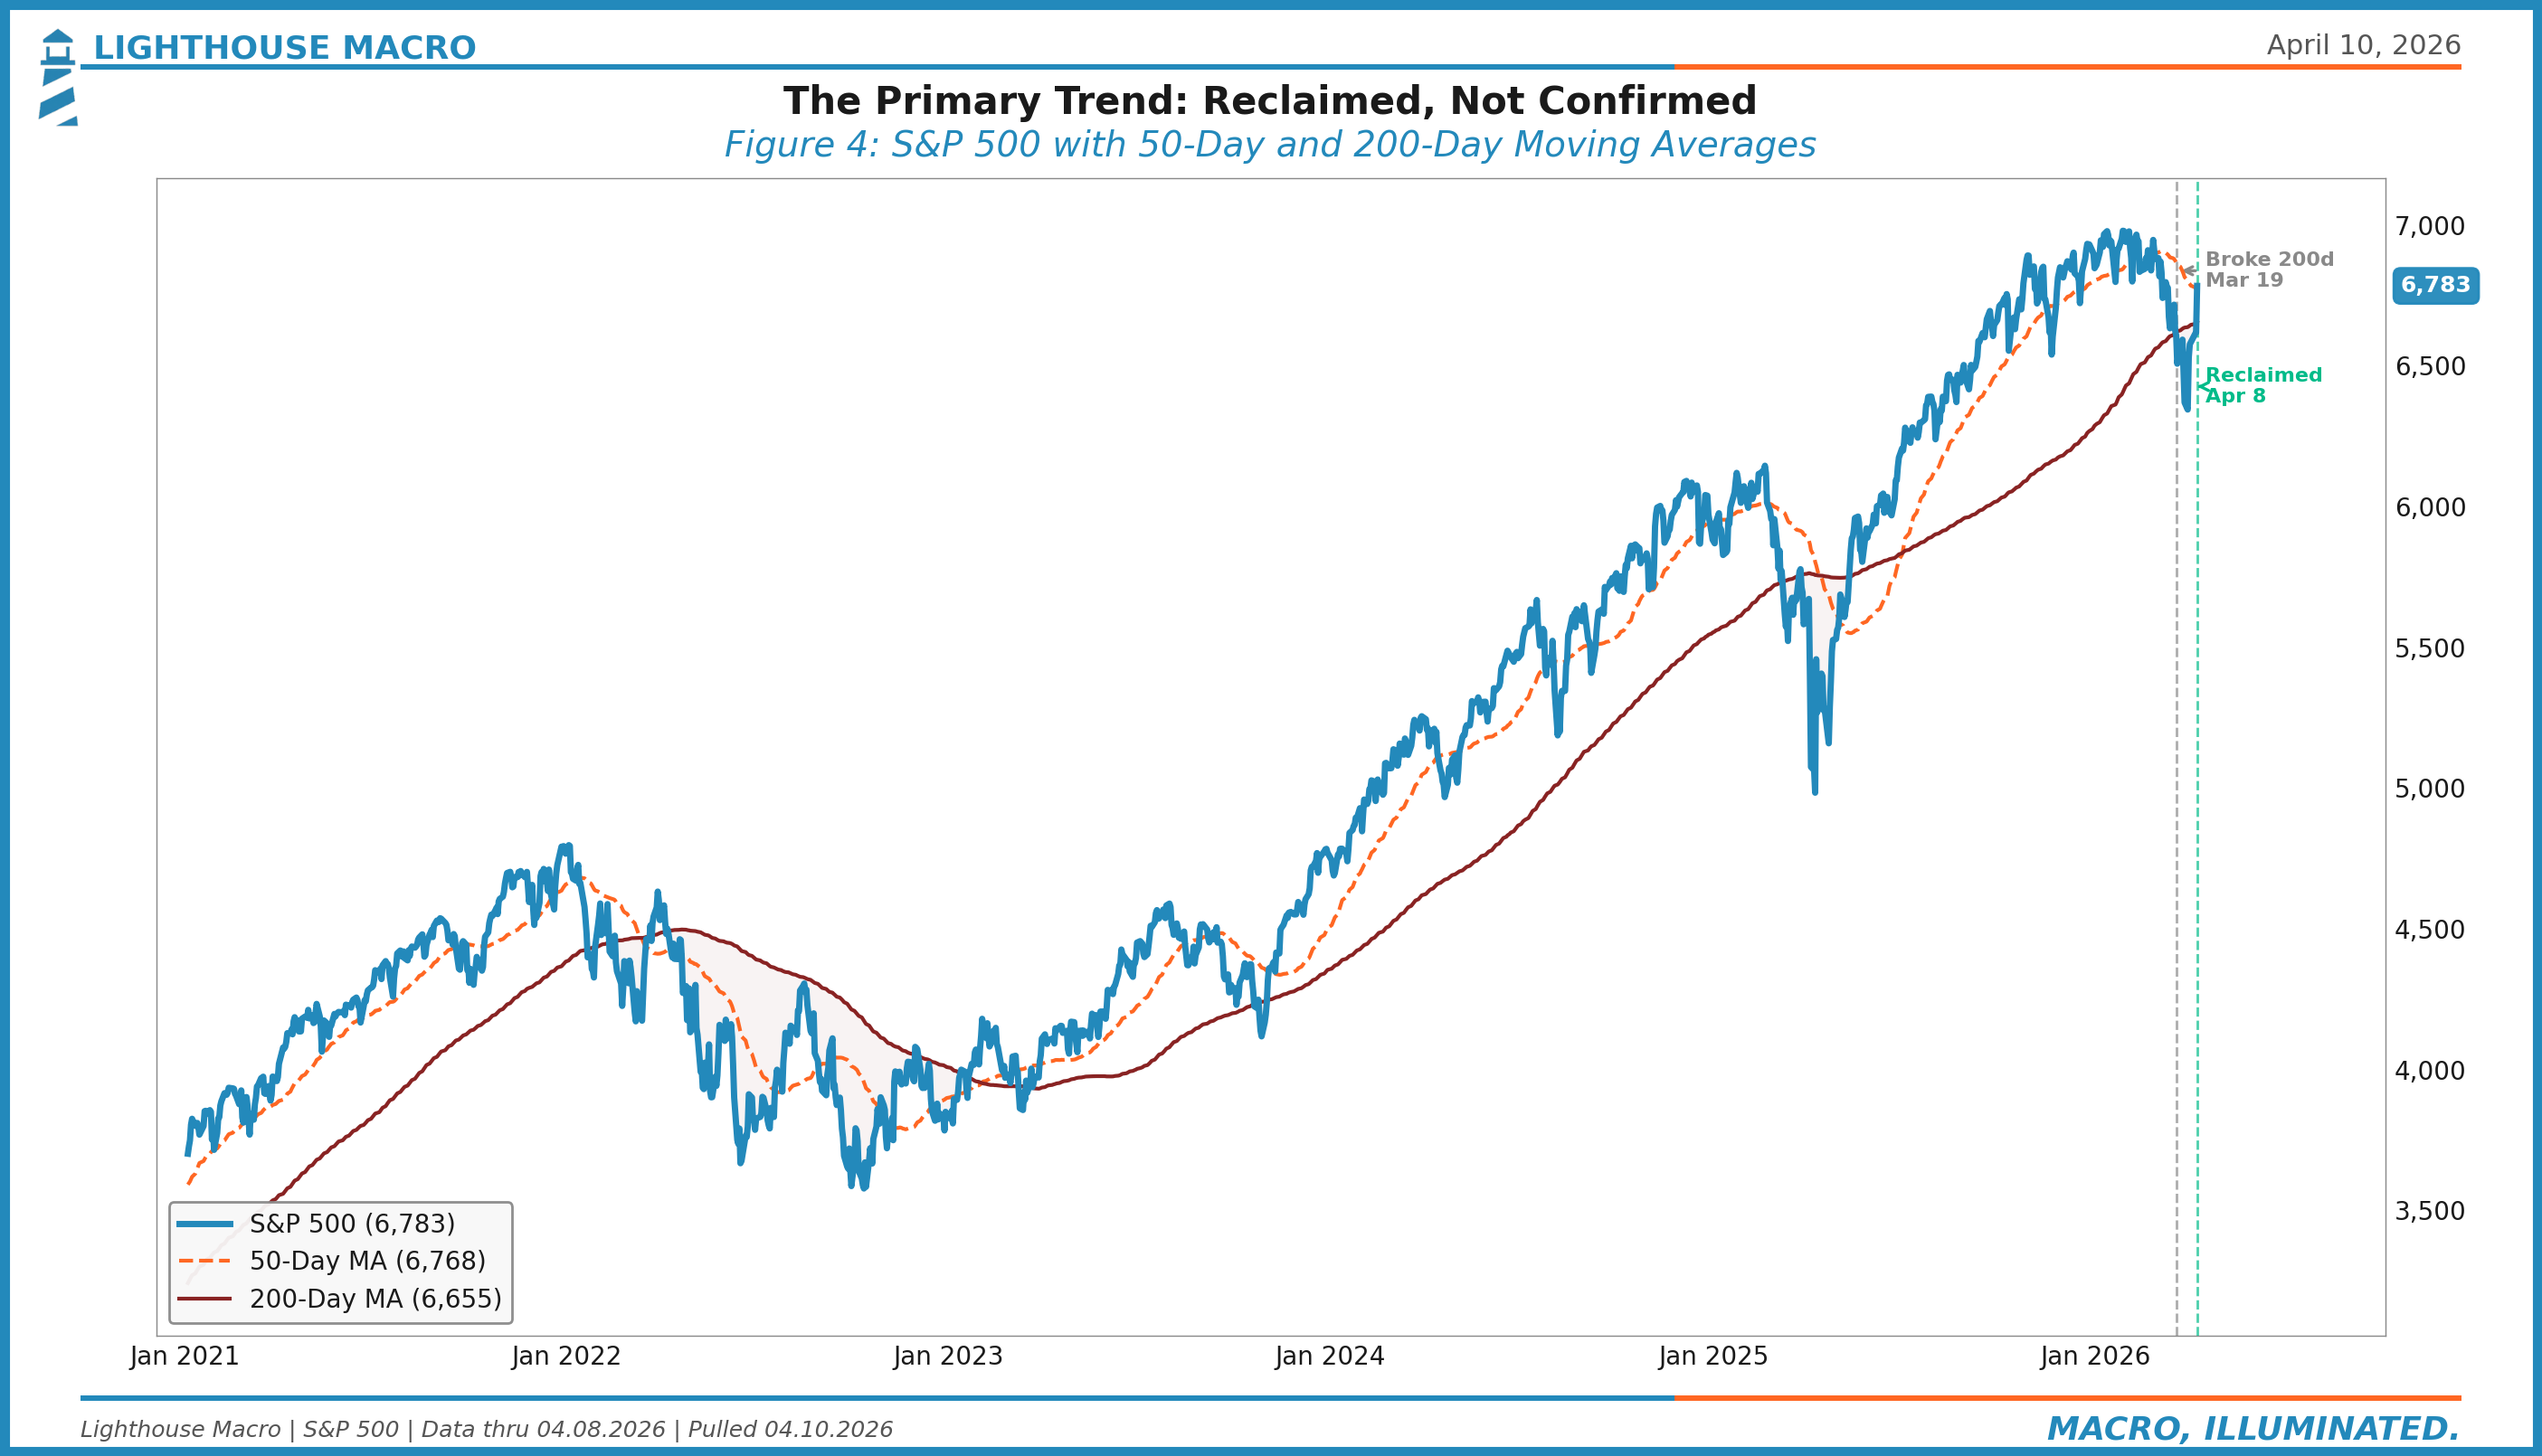
SPY broke below its 200-day on March 19. It stayed there for 20 calendar days, 14 trading sessions, before the ceasefire gap-up on April 8 carried it back above. By Thursday’s close, the index sat at 6,824, roughly 180 points above the 200-day at 6,644. That’s a clean reclaim on a closing basis.
But context matters. The reclaim happened on a single exogenous catalyst (the ceasefire), not on a gradual improvement in fundamentals. The 200-day itself has flattened. And the 50-day at 6,784 was barely cleared. The question isn’t whether price is above the line. The question is whether it holds there for 5+ sessions on expanding breadth. History says one-day reclaims on news gaps have about a 55% success rate. Five-day holds jump to 78%.
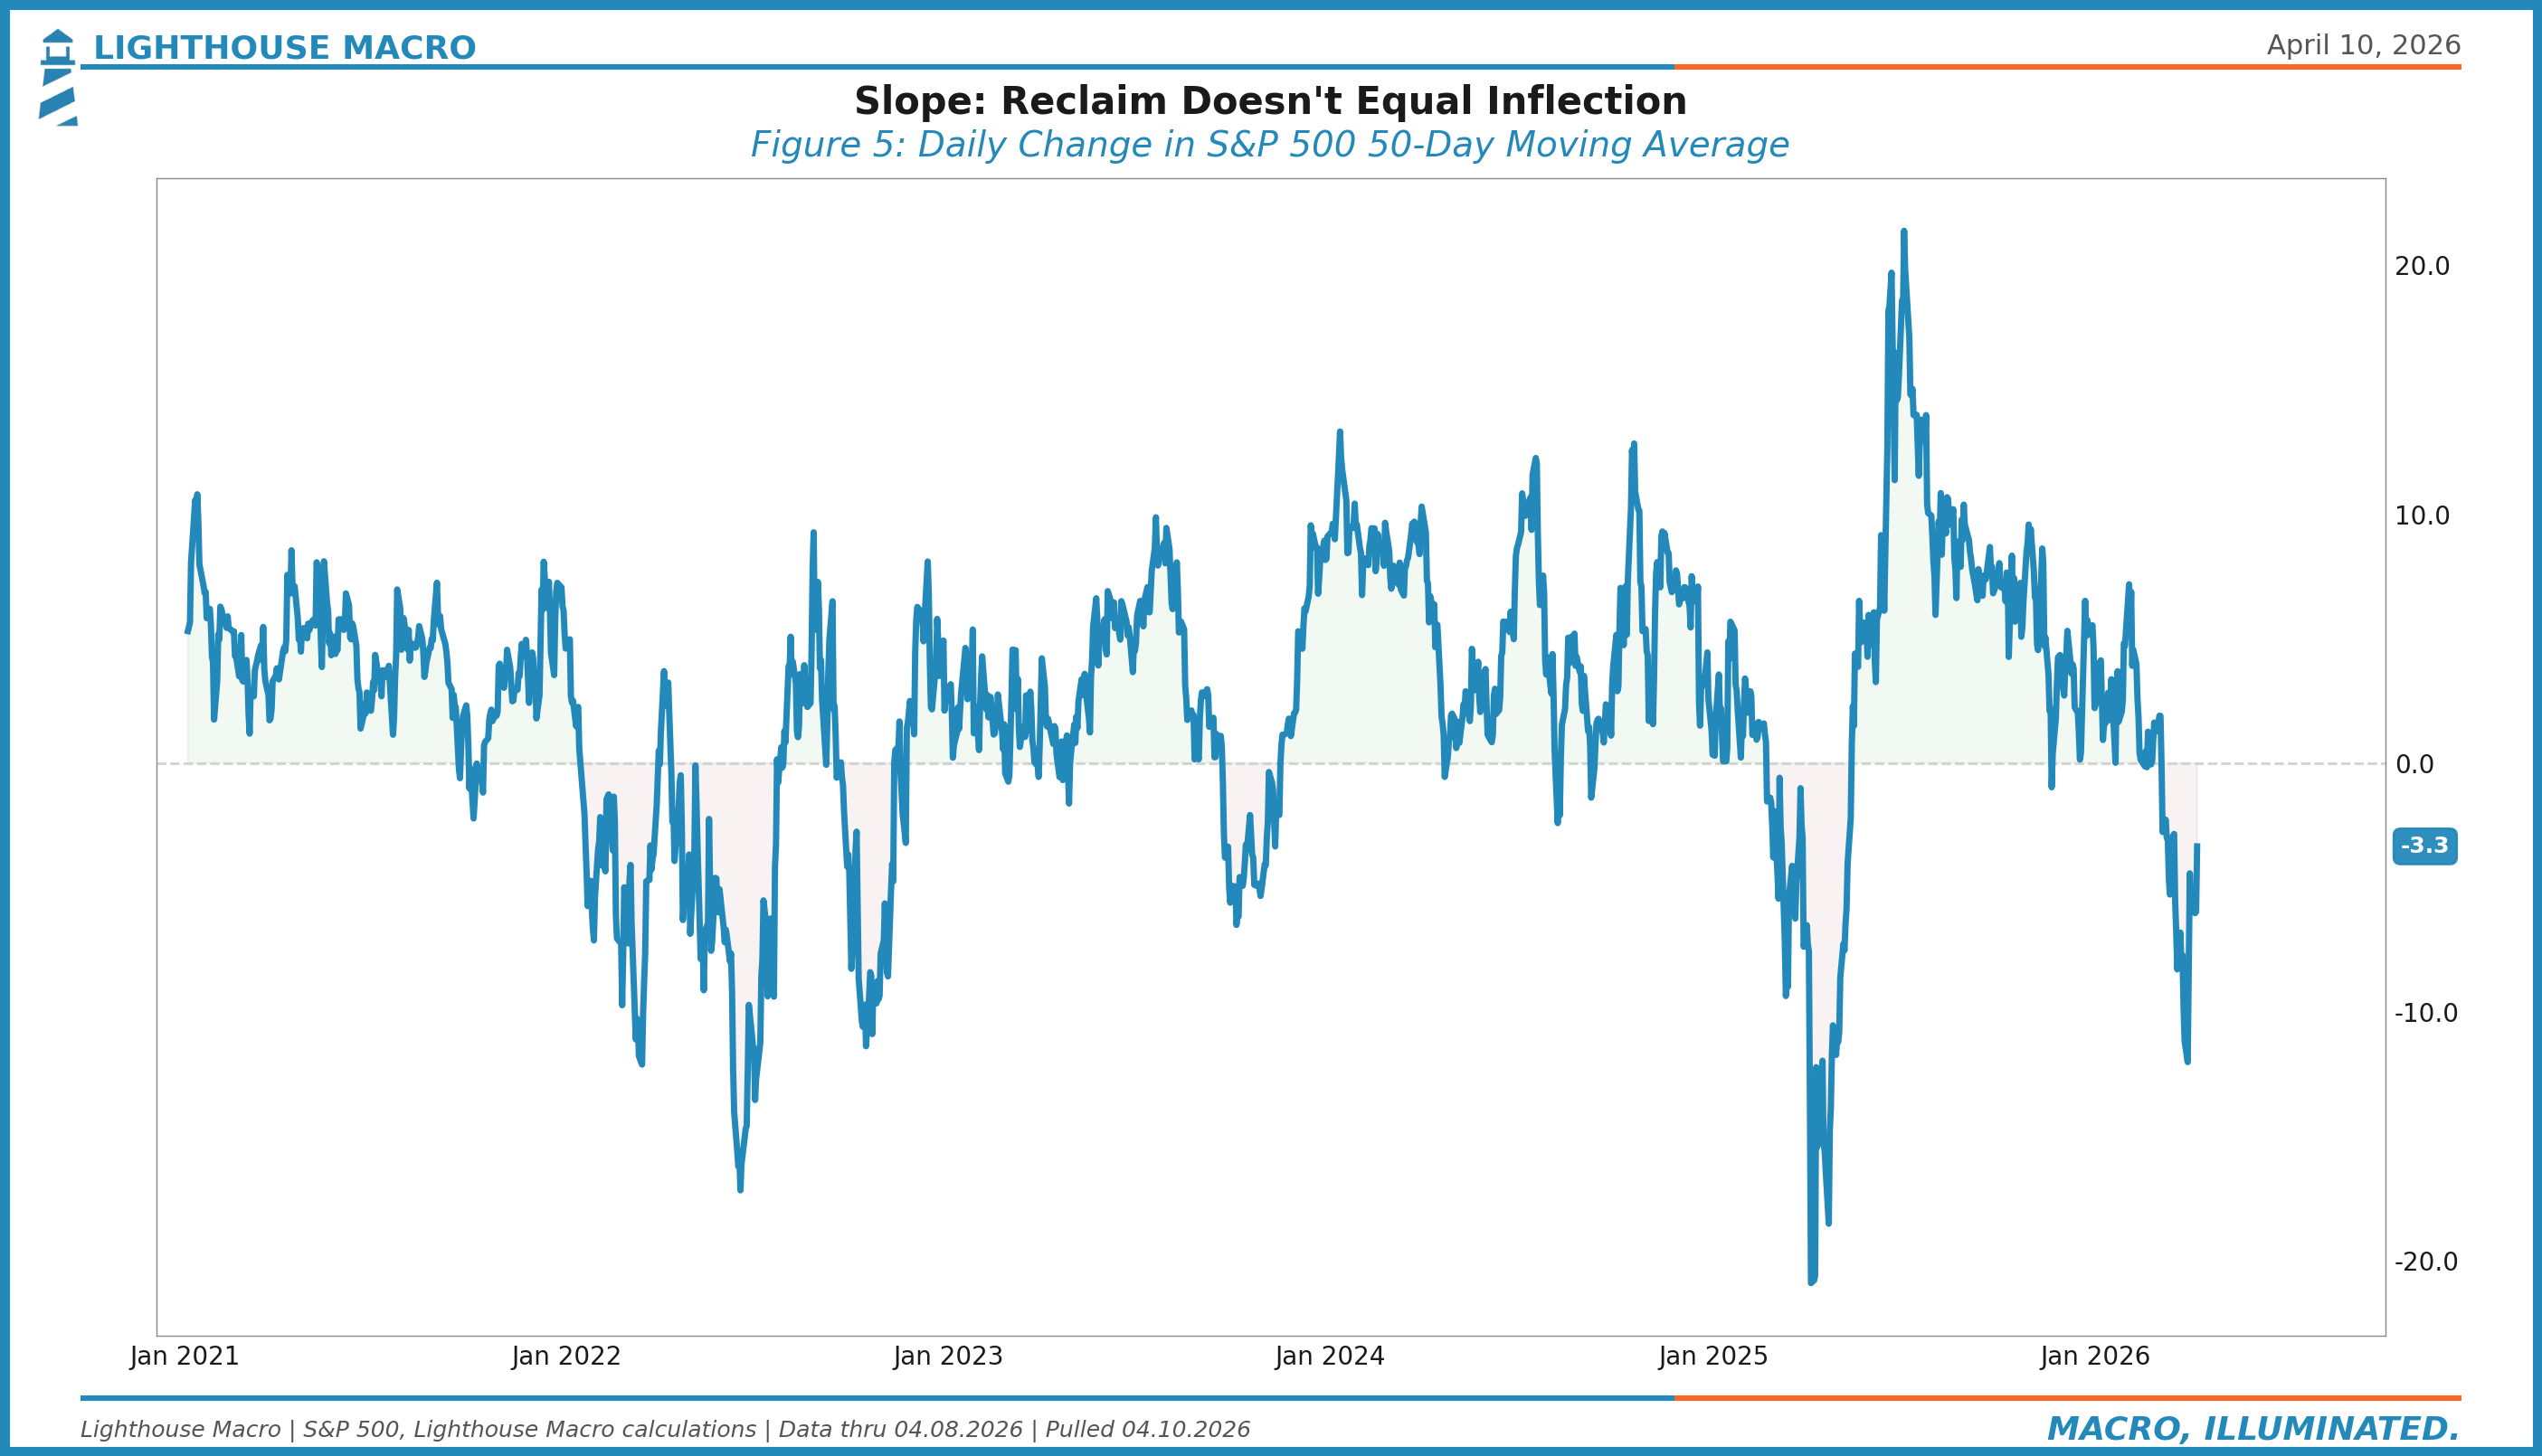
50-Day Moving Average Slope
The slope of the 50-day tells you whether the intermediate trend is accelerating or decelerating. A rising slope means price is pulling away from the average. A falling slope means the average is catching up, or worse, price is falling away from it in the wrong direction.
Right now, the 50-day slope is negative and has been since mid-March. The two-day rally pushed price above the 50-day itself (6,824 vs. the 50-day at 6,784), but the slope of the average hasn’t turned. A rising slope requires the average itself to inflect upward, which takes sustained price action above it for multiple sessions. We’re on day two.
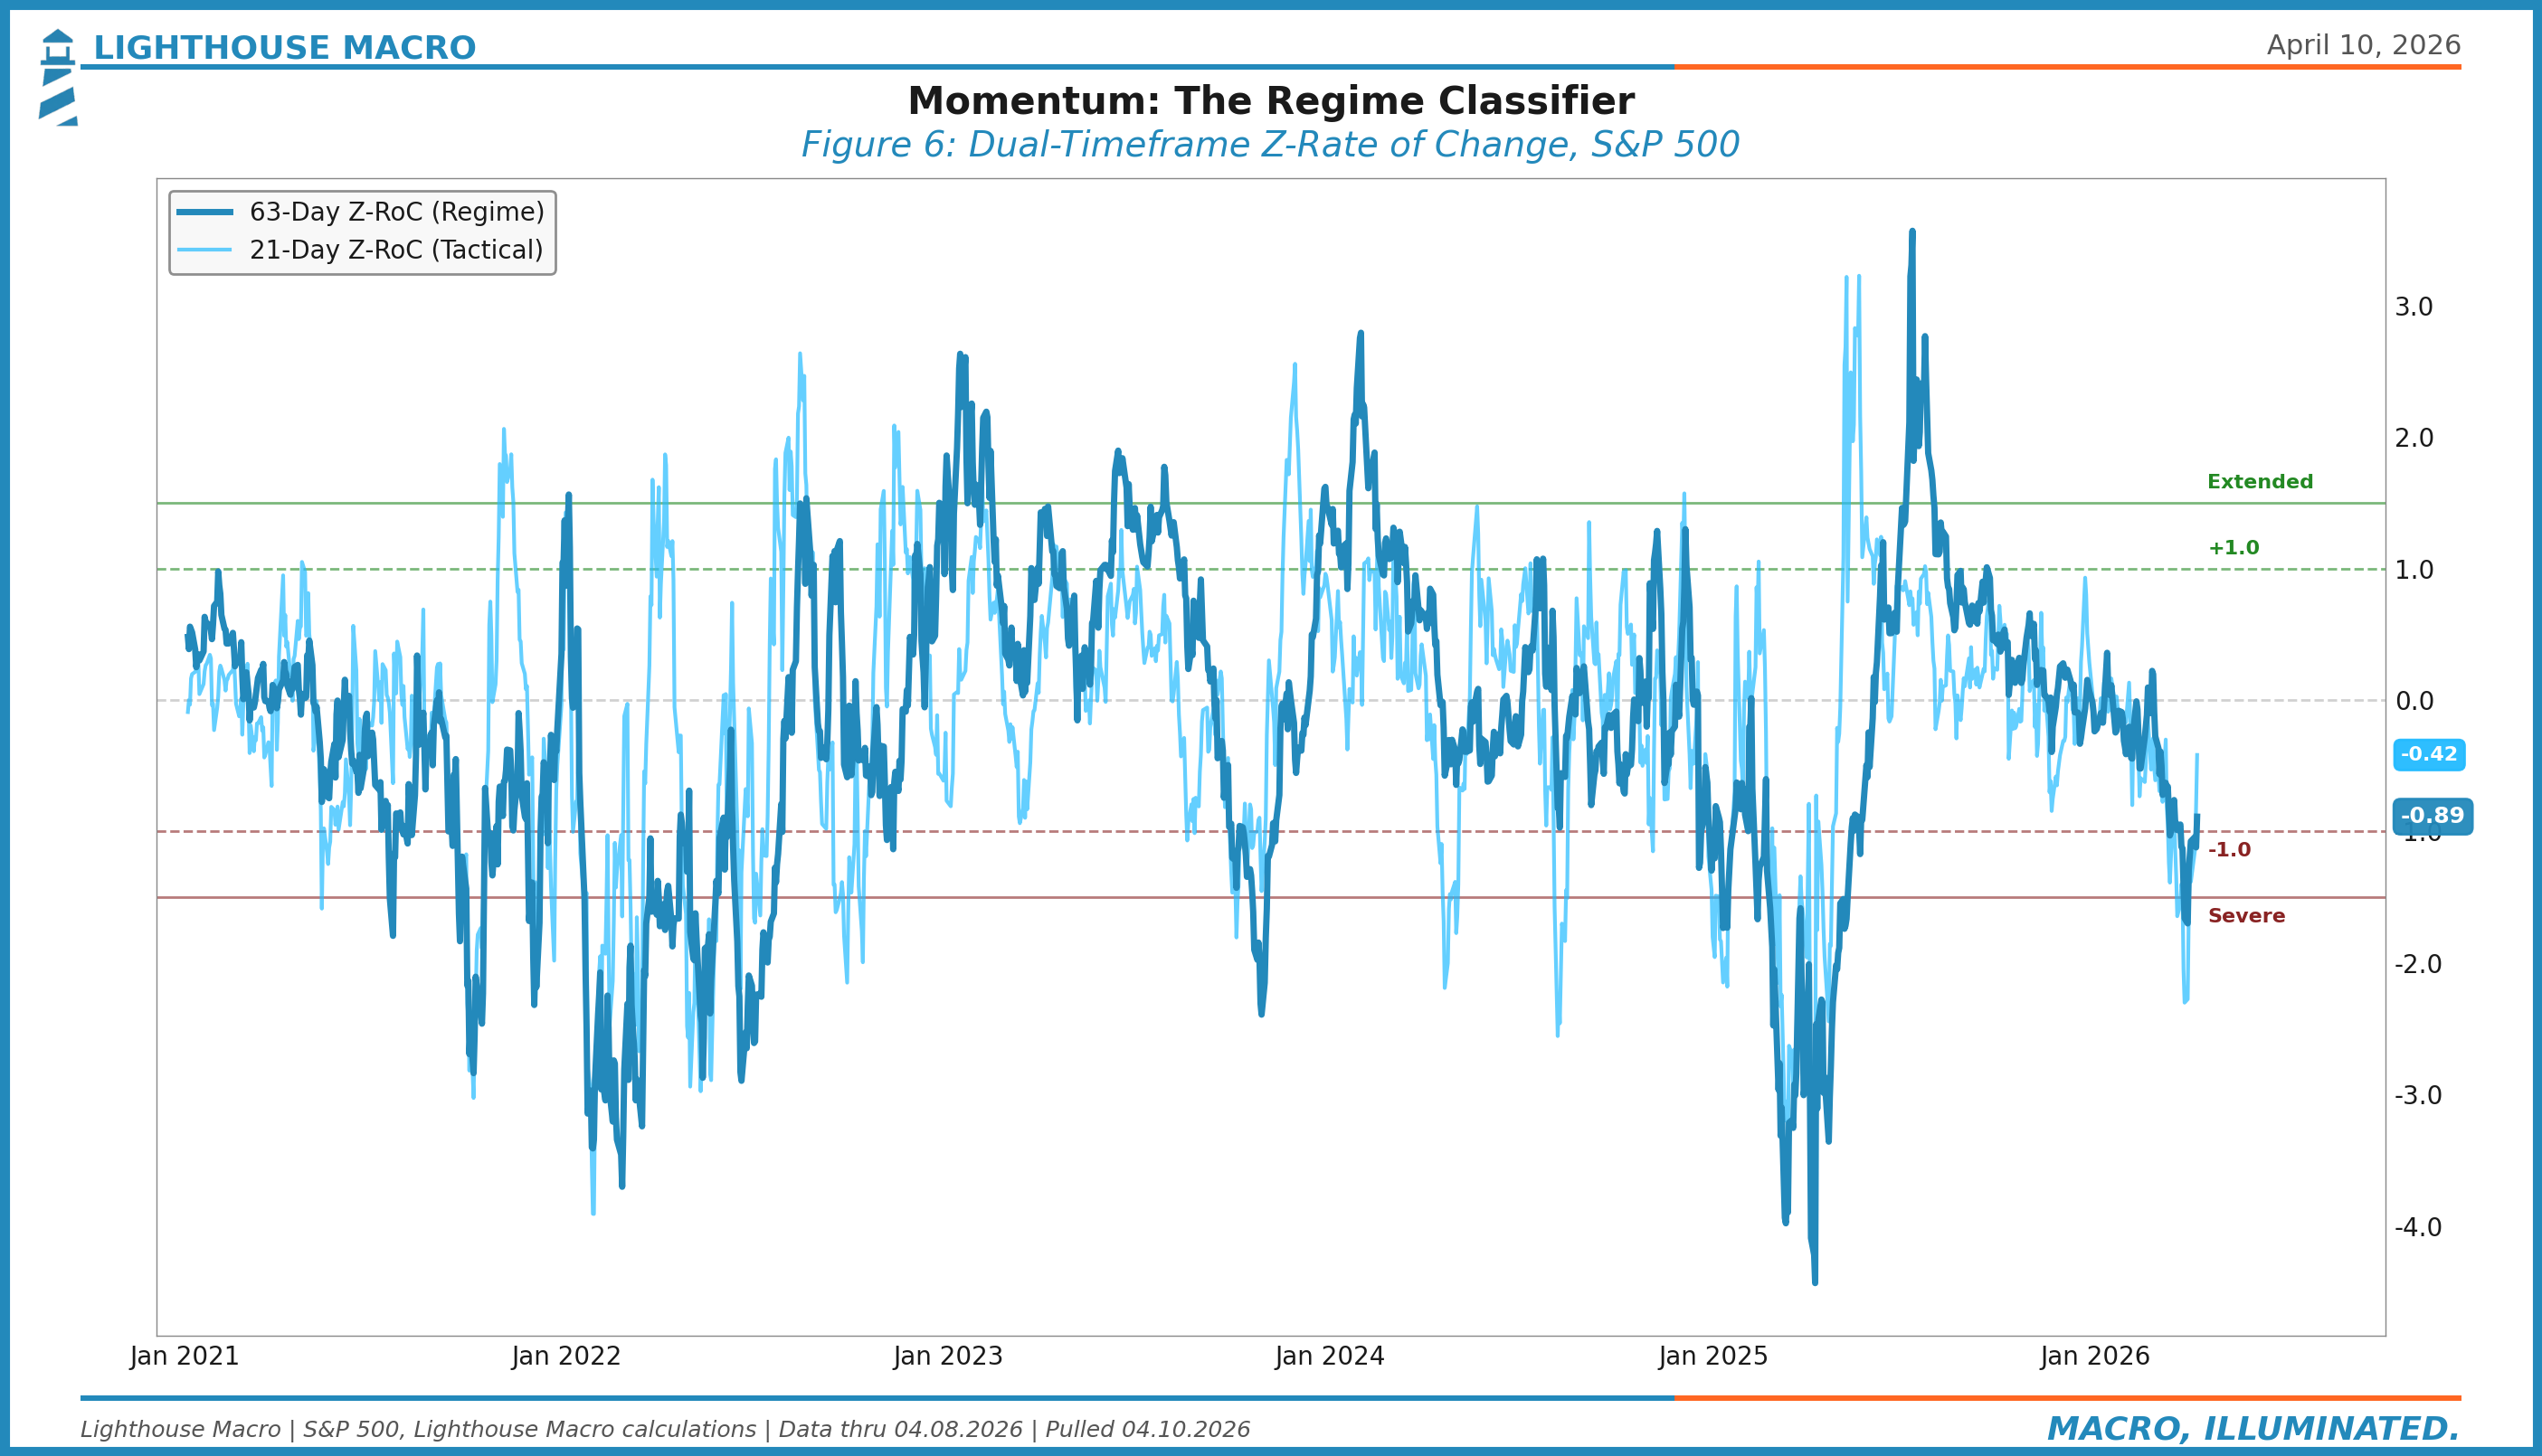
Z-Rate of Change (63-Day)
The Z-RoC is the momentum backbone of the MSI. It measures the standardized 3-month rate of change. What makes it useful isn’t the raw number but how it compares to history. A -10% drawdown in a low-volatility environment scores very differently than -10% in a high-volatility one.
Readings below -1.0 indicate broken momentum. Below -1.5, the damage is severe enough that mean reversion odds start to favor the bulls, but only if breadth confirms. Momentum alone isn’t a buy signal. Momentum plus breadth is.
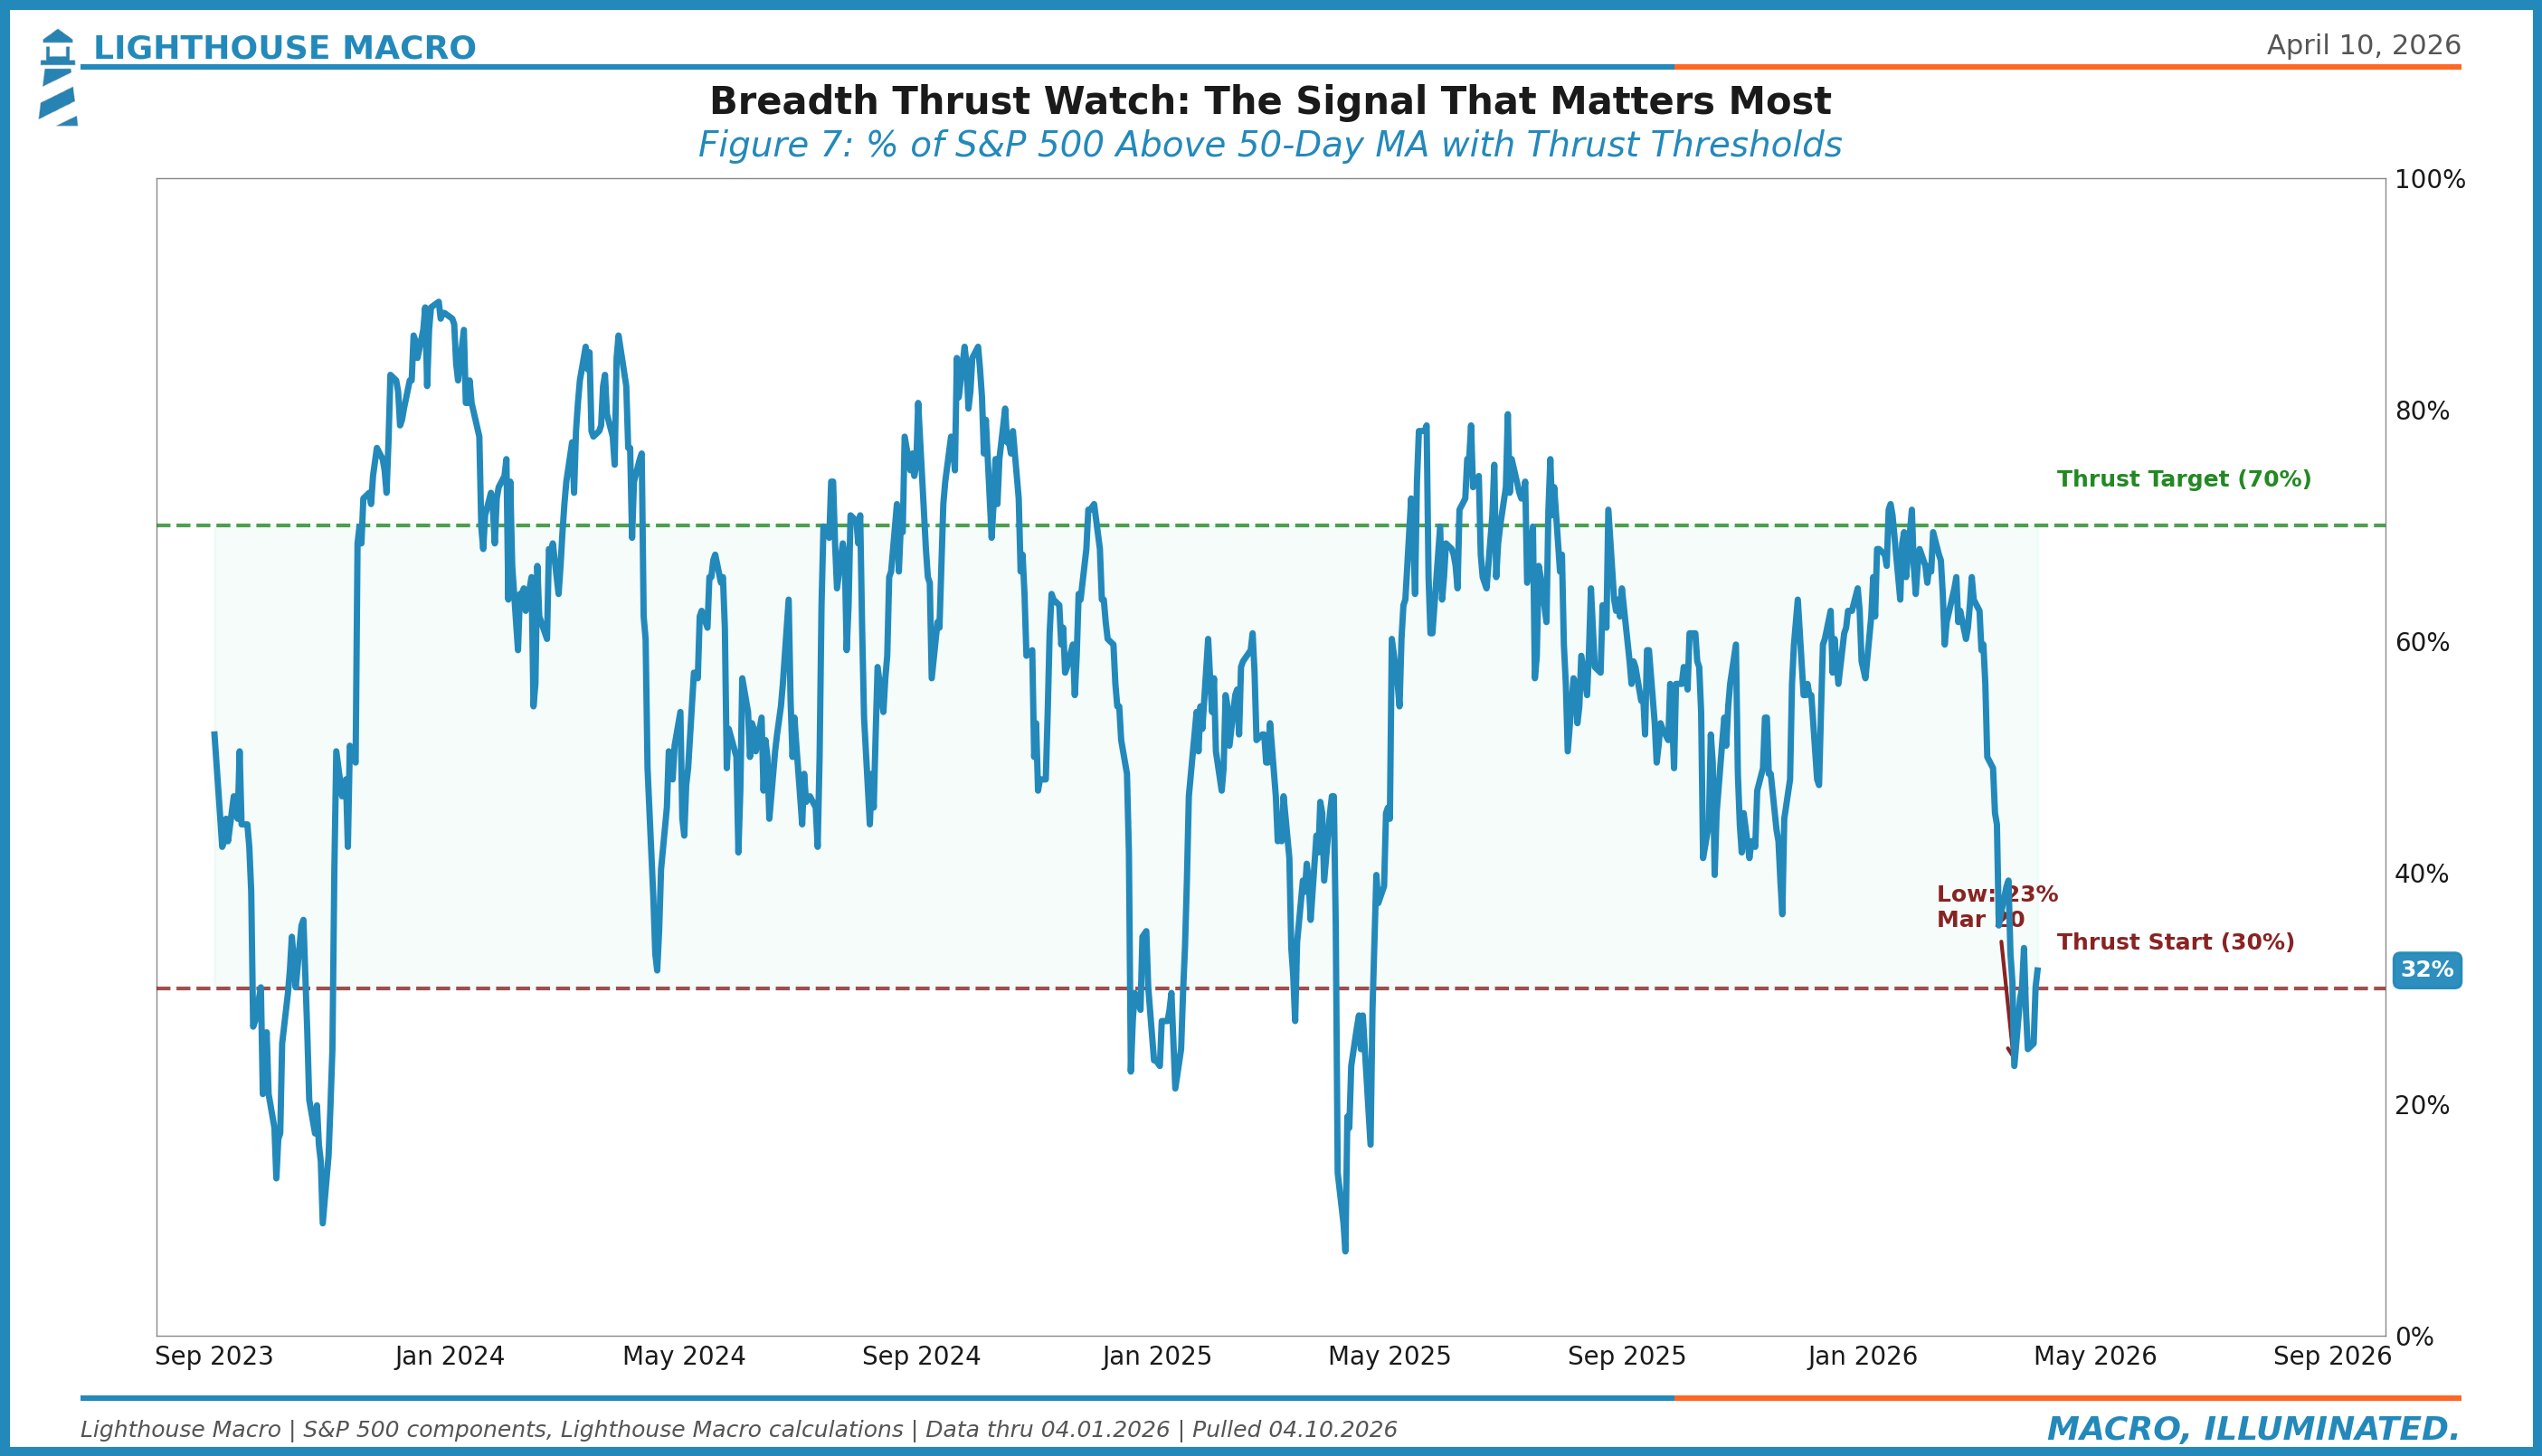
Breadth: % Above 50-Day MA
This is the participation metric we watch most closely. It answers: what percentage of S&P 500 stocks are above their own 50-day moving averages?
At extremes, this indicator is powerful:
Below 25%: The market is washed. Selling is exhausted at the individual stock level. This doesn’t mean it bounces tomorrow, but it means the fuel for further selling is running low.
Above 85%: The market is crowded. Nearly everyone is in an intermediate uptrend. The easy money has been made.
30% to 70% in 10 sessions (Breadth Thrust): One of the most reliable buy signals in equity markets. It means participation is expanding rapidly from a washed base. The last confirmed thrust preceded a +12% rally over the following 3 months.
We’re watching in real time. After seven straight up sessions, the % above 50-day has recovered from the mid-20s (late March lows) to what is likely the mid-40s to low-50s range. But a thrust requires 30% to 70% in 10 sessions. We’re inside the window. If it triggers in the next few days, that changes the structural picture materially.
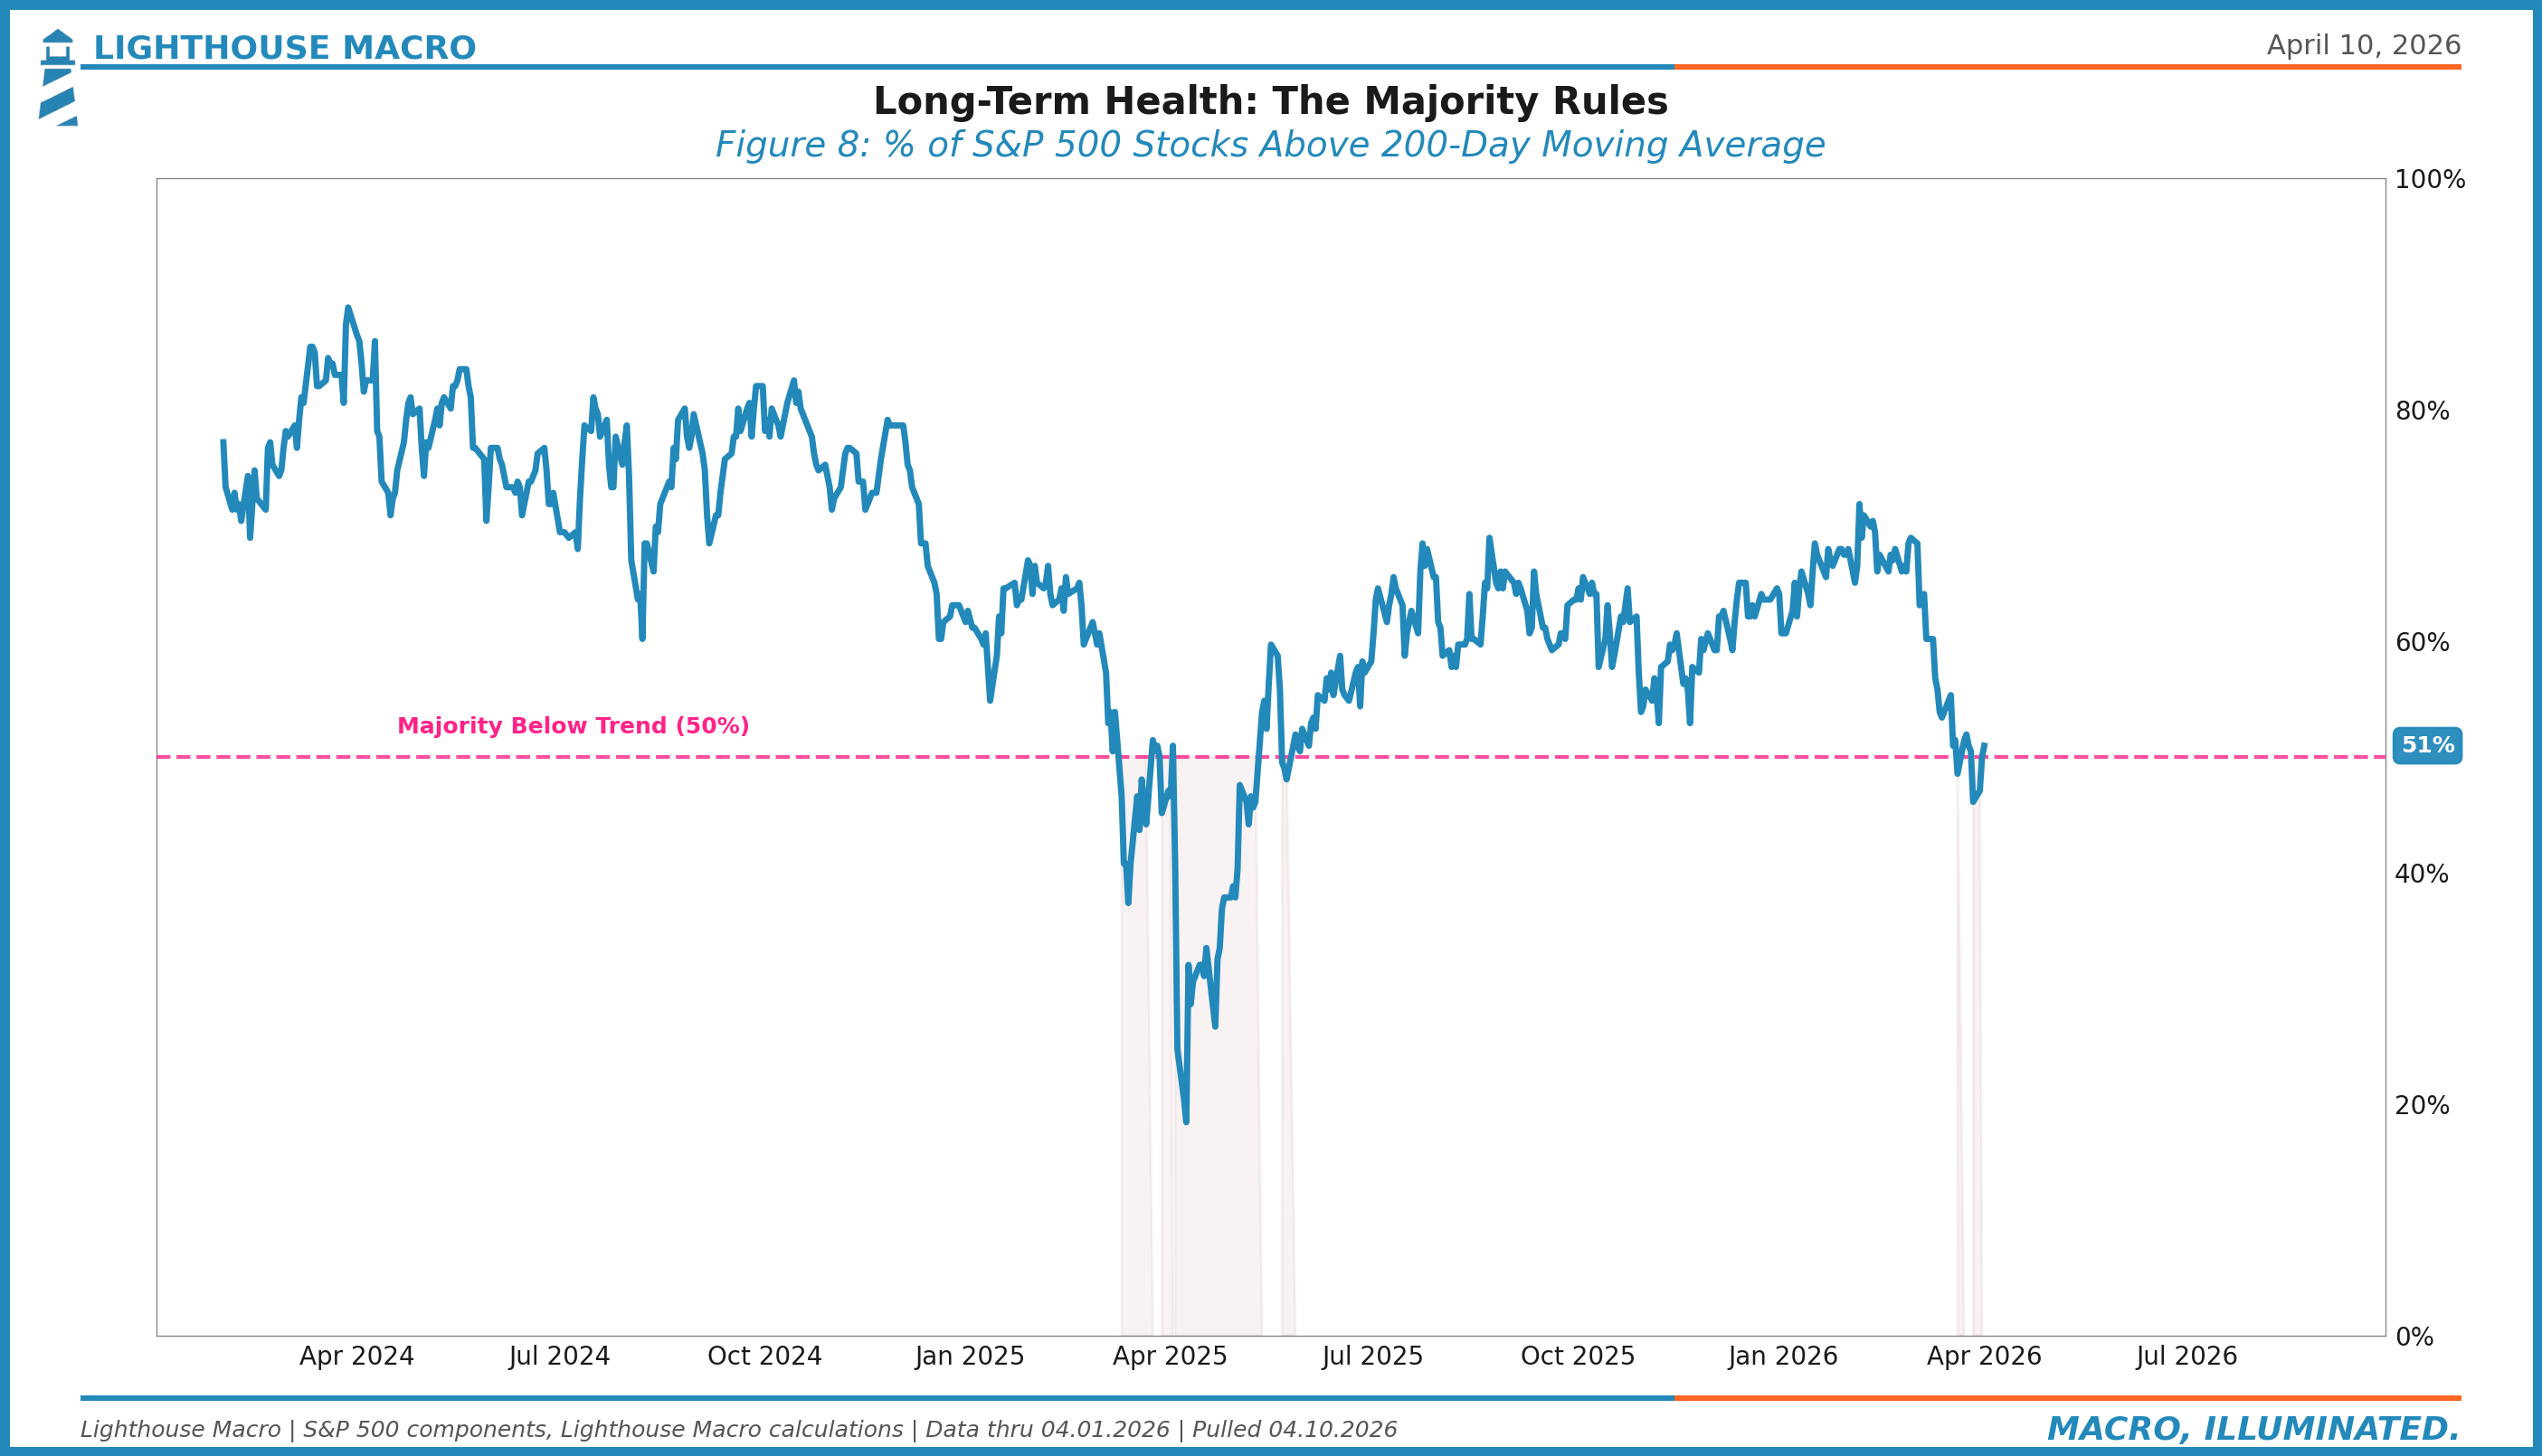
% Above 200-Day MA
The long-term version. When this falls below 50%, more stocks are below their primary trend than above it. The market is structurally unhealthy regardless of what the cap-weighted index says.
This metric fell sharply in March as the oil shock and tariff uncertainty hit mid-caps and small-caps harder than mega-caps. The divergence between the index (which held up relatively well on mega-cap resilience) and the median stock (which didn’t) was a textbook narrowing signal.
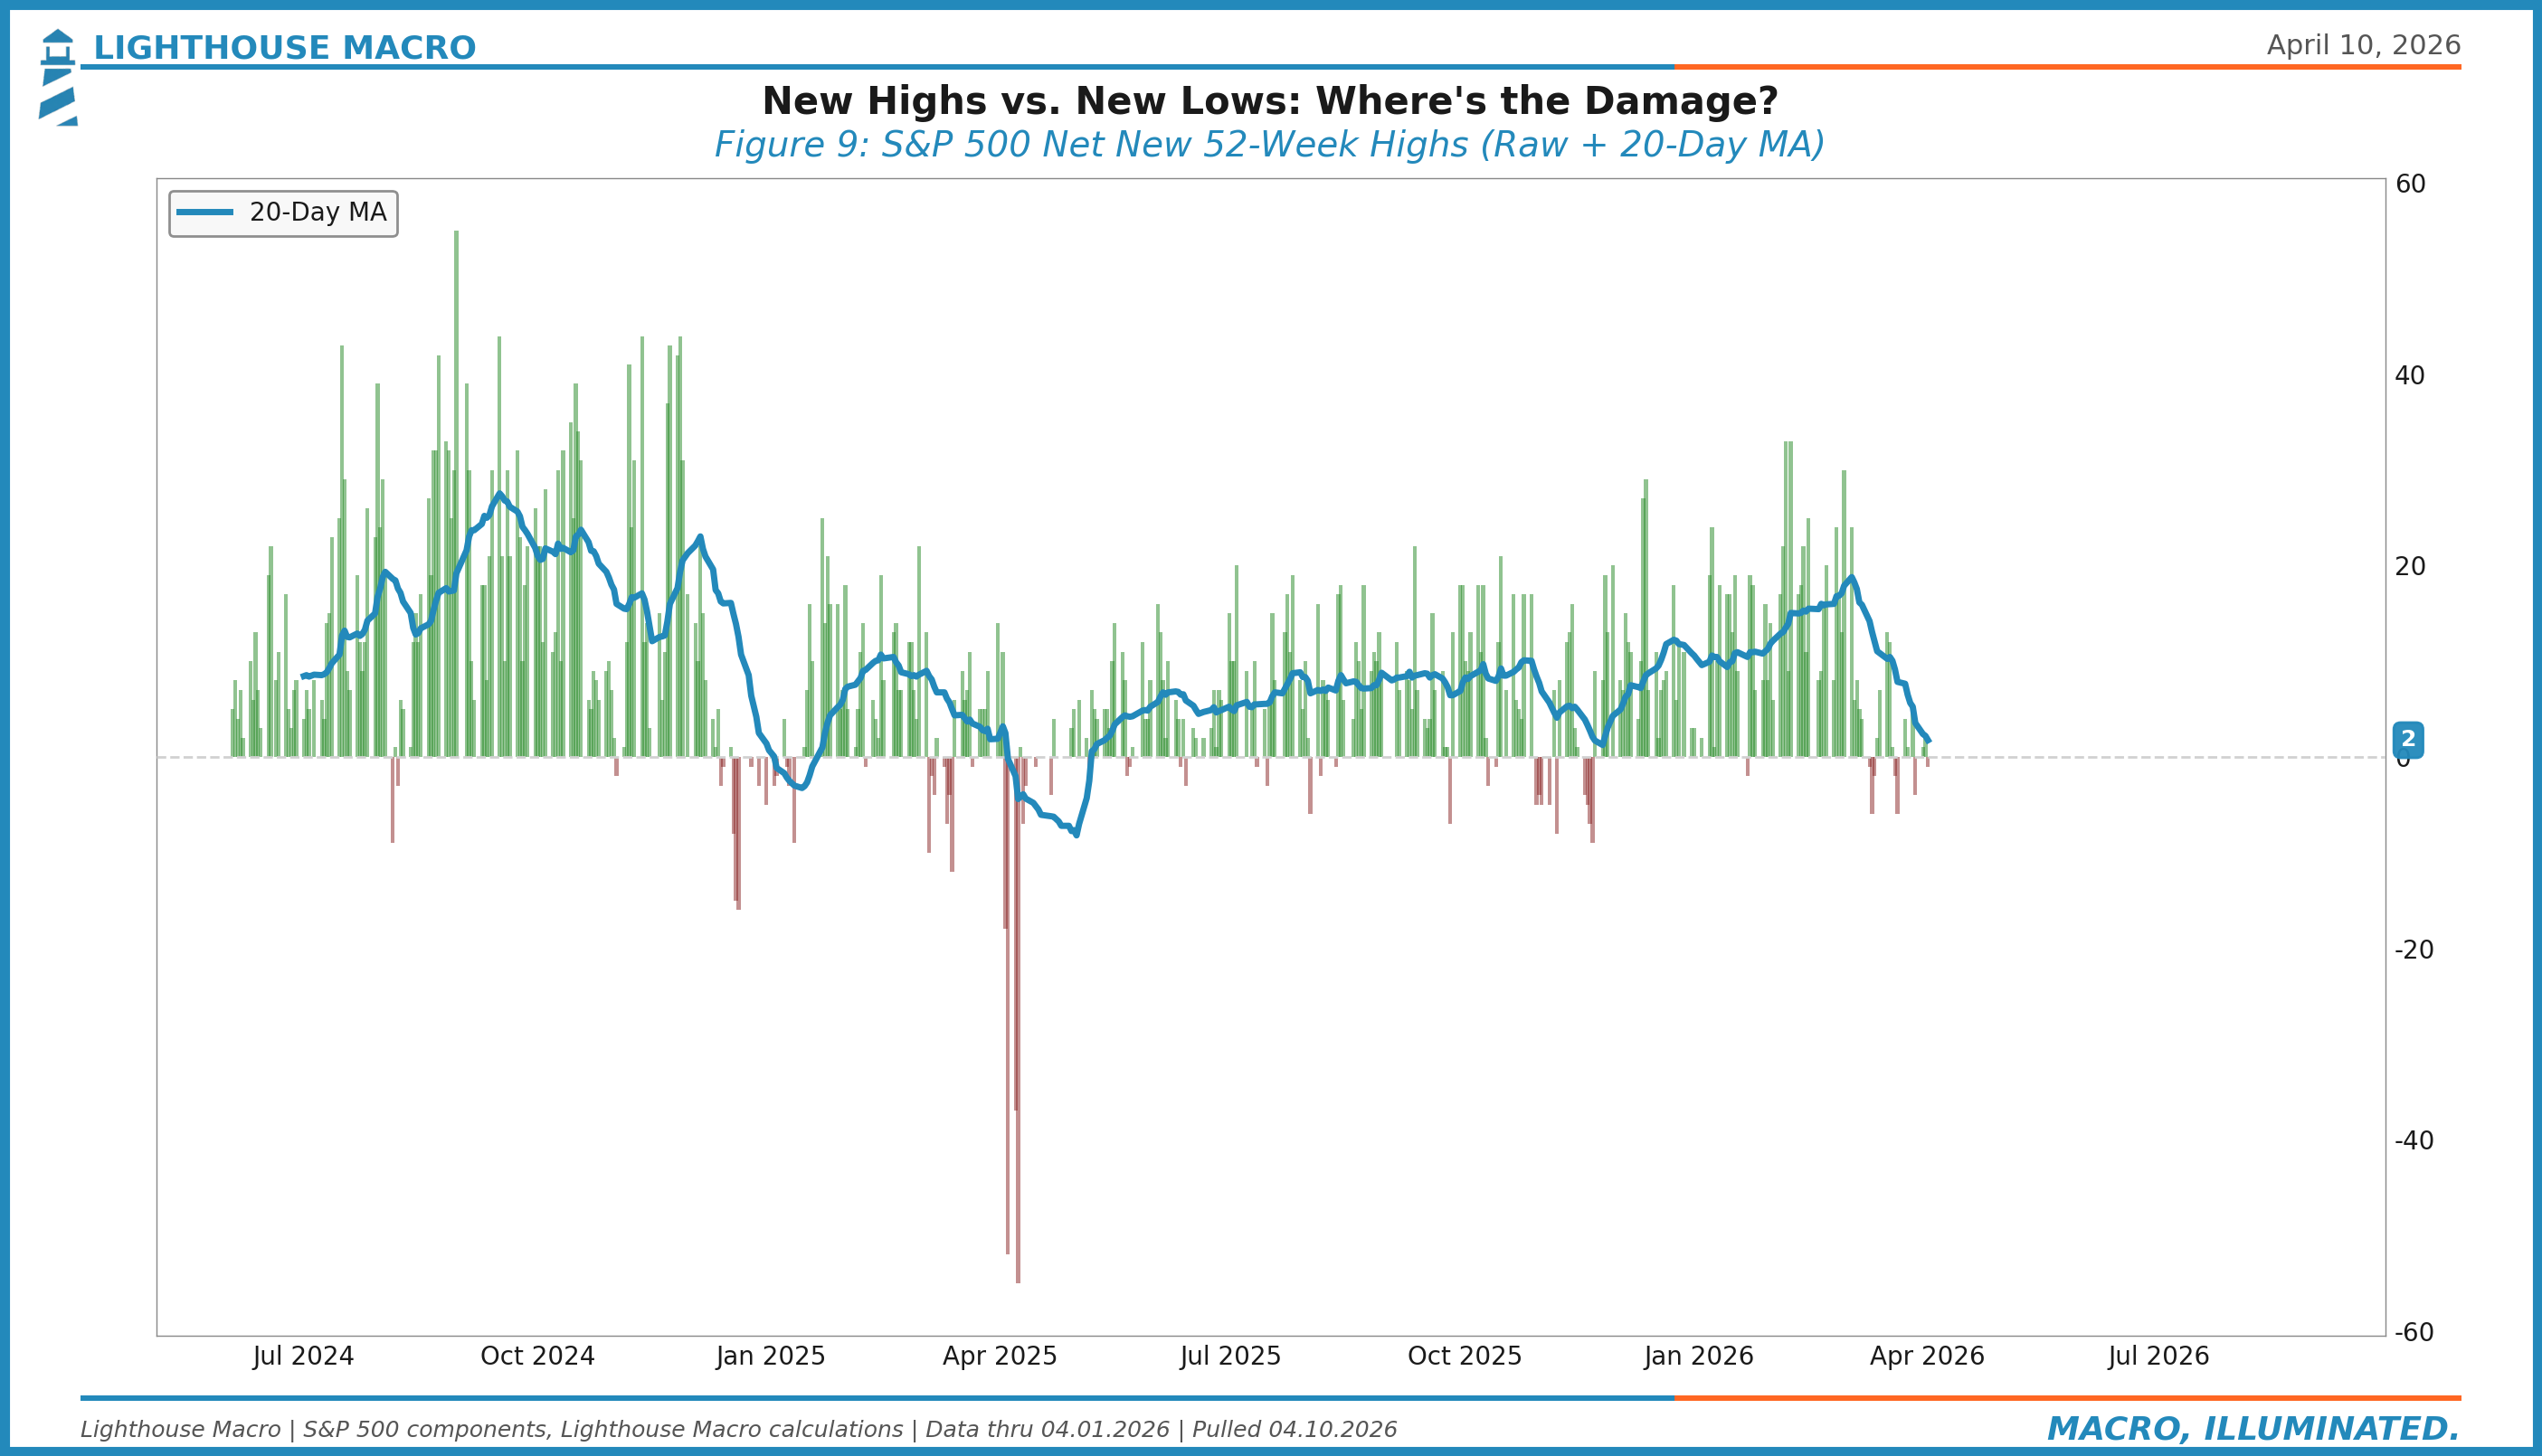
New Highs Minus New Lows (20-Day MA)
The flow of new extremes. When new 52-week lows outnumber new highs, the damage is broad and deepening. When the ratio flips, it’s a sign that the worst of the selling pressure has passed.
We smooth this with a 20-day moving average to filter out single-day noise. The signal matters when it crosses zero. A sustained move from negative to positive, especially from deeply negative territory, is confirmation that the internal tide is turning.
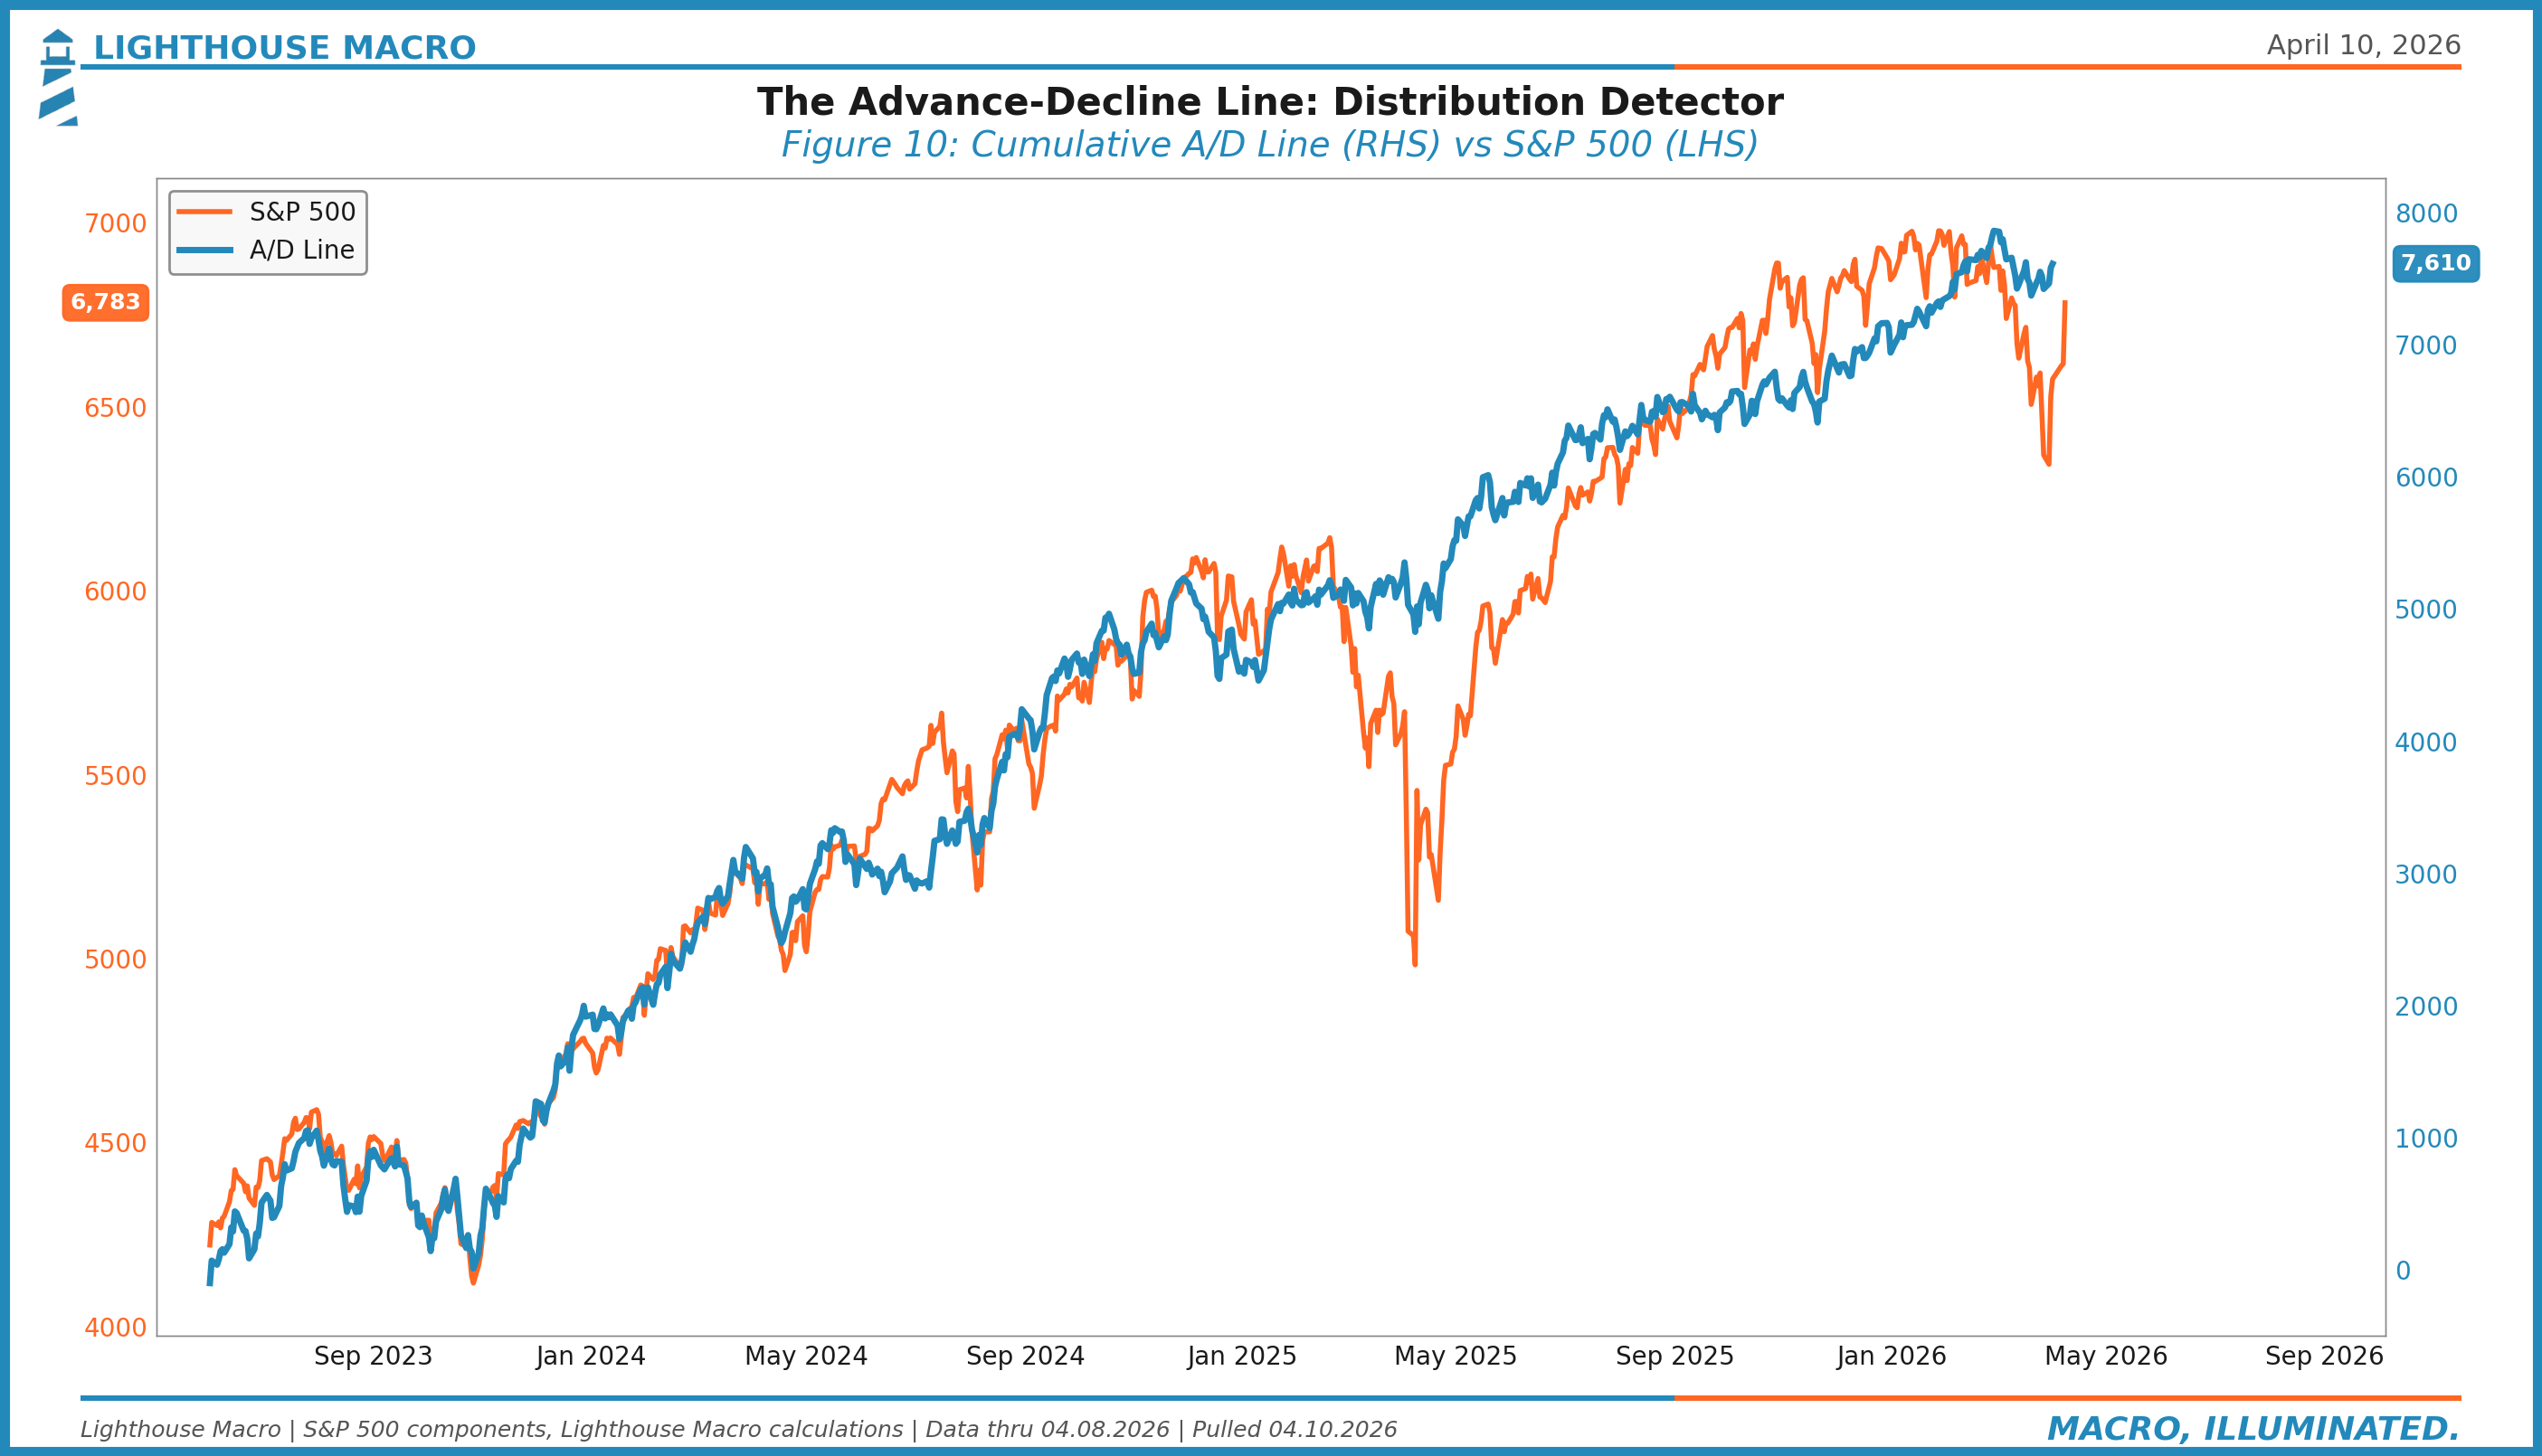
Advance-Decline Line
The cumulative advance-decline line tracks the running total of advancing stocks minus declining stocks. It’s the oldest breadth measure in the book, and it still works.
The signal comes from divergences. If the S&P 500 is making new highs but the A/D line isn’t, distribution is happening beneath the surface. Someone is selling into strength. This divergence preceded the 2000 top, the 2007 top, and the 2022 top.
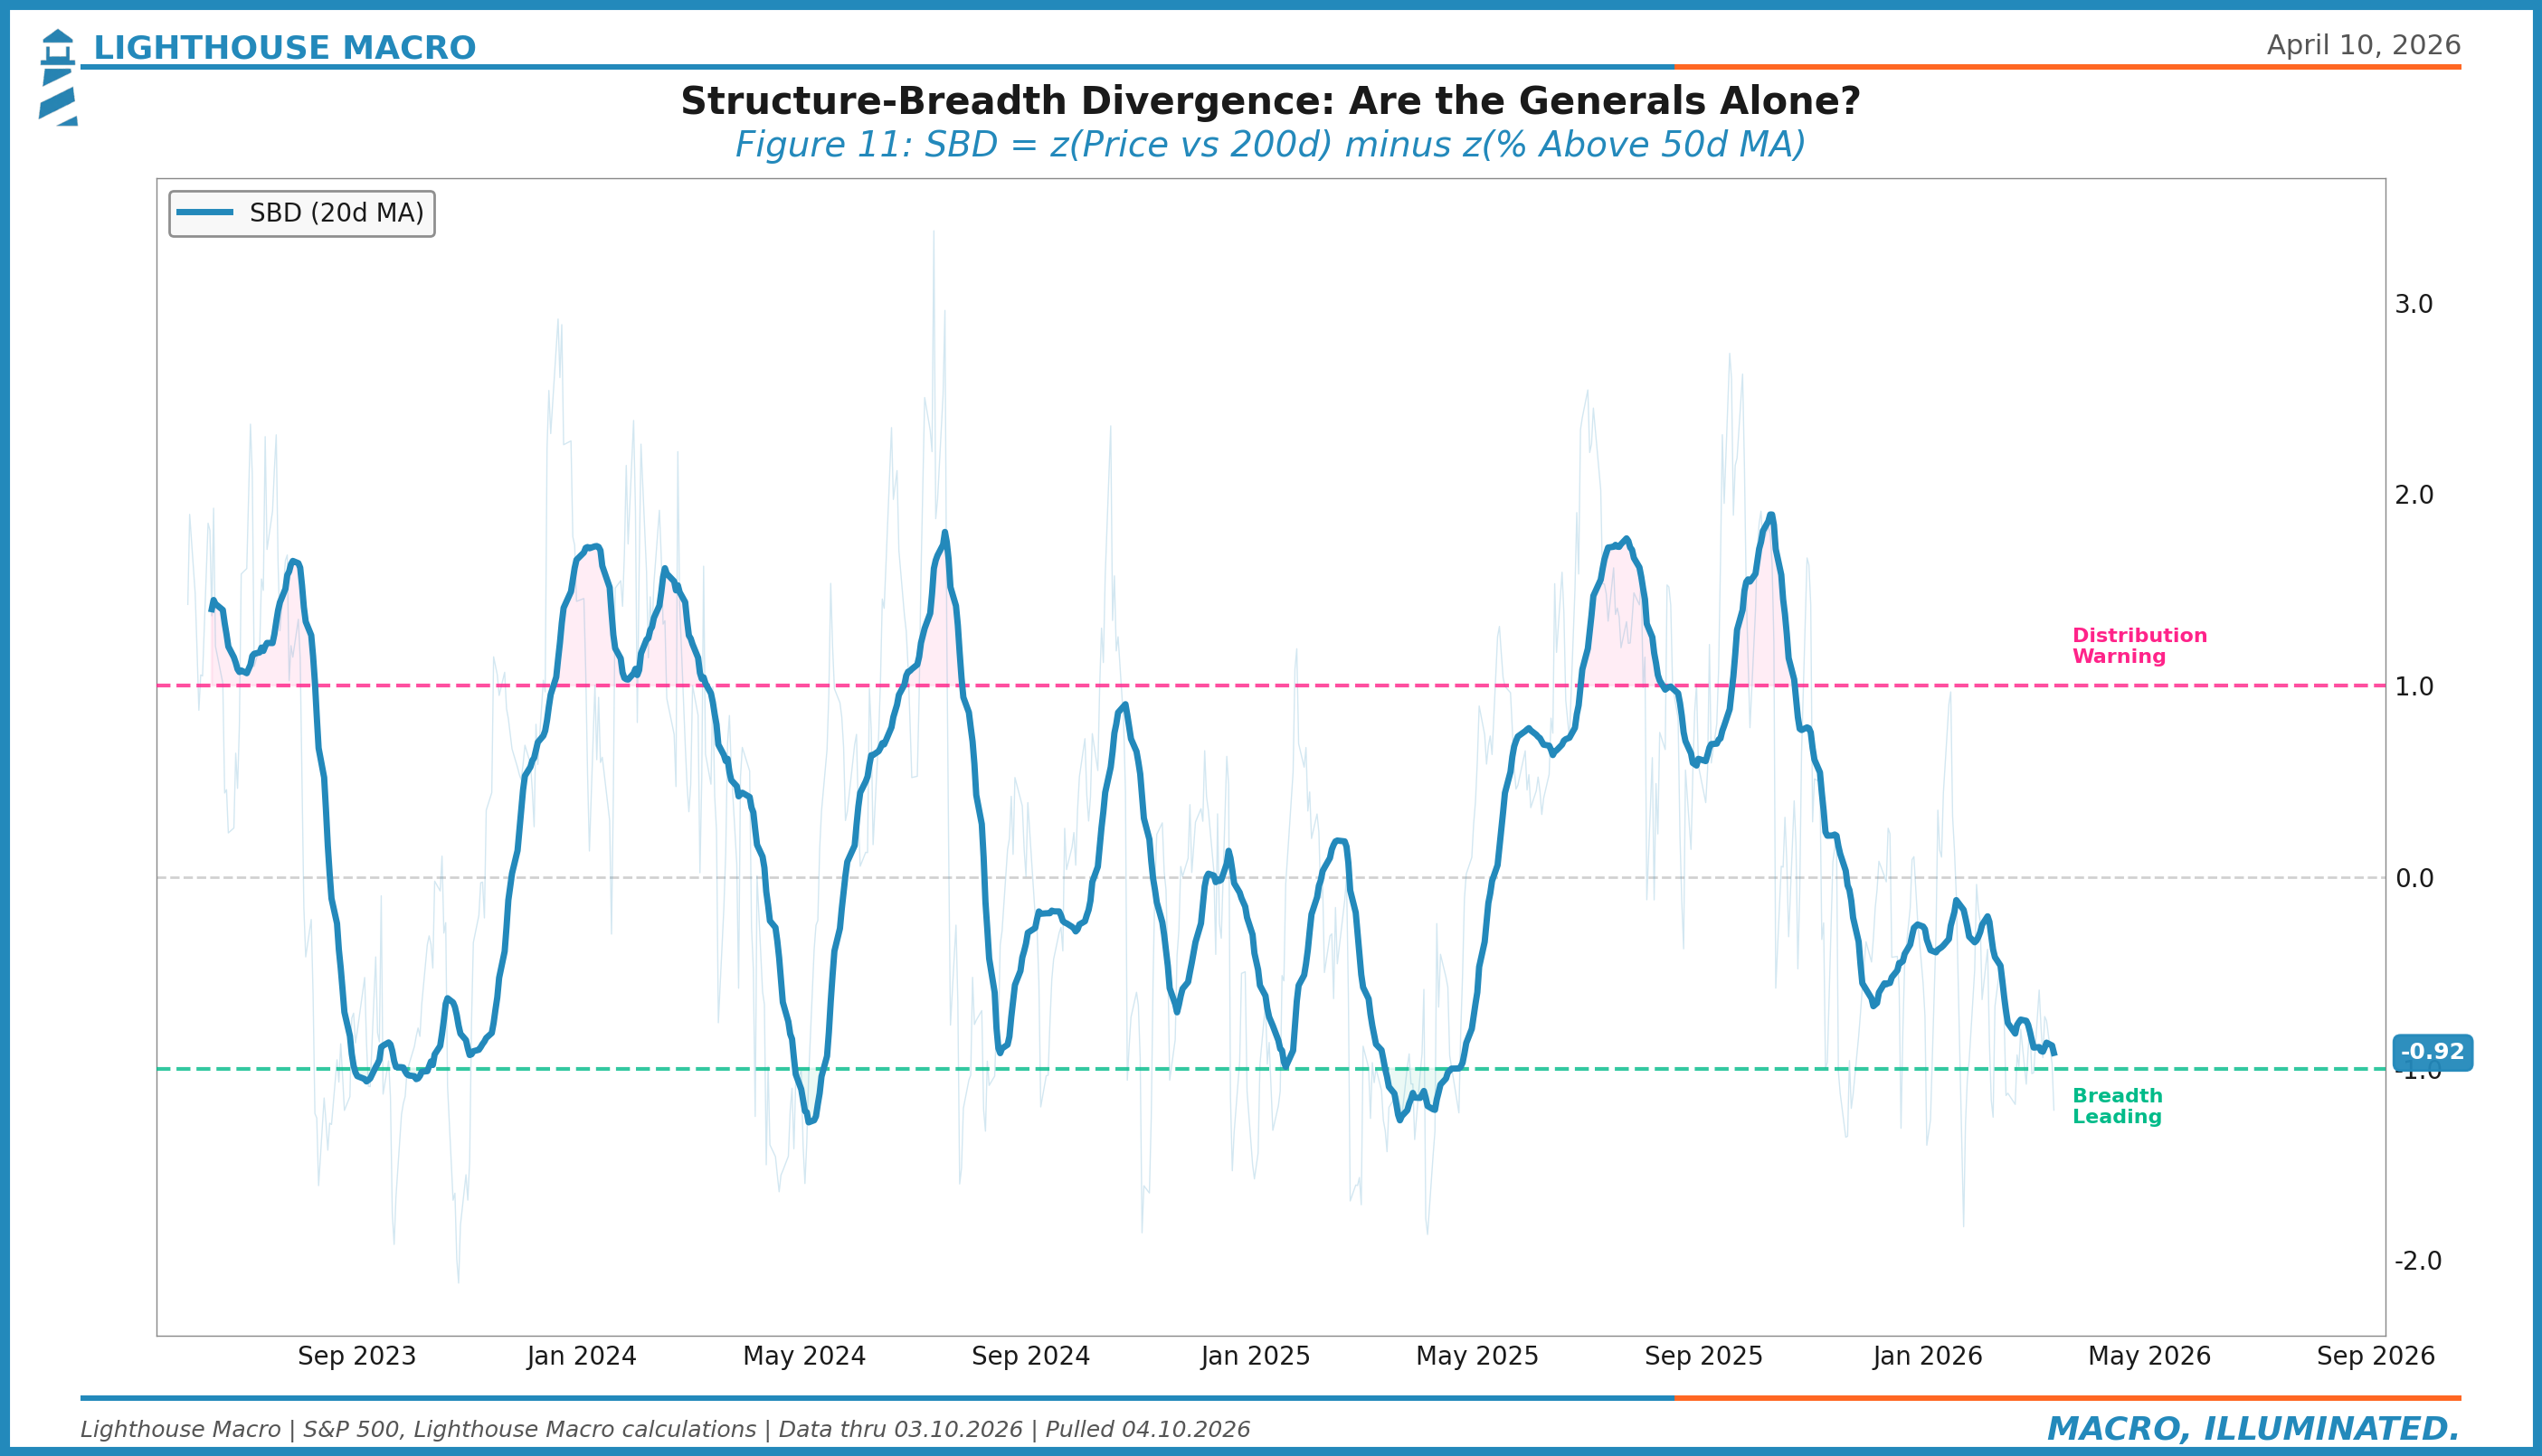
The Structure-Breadth Divergence (SBD)
We built one more layer on top of the MSI. The Structure-Breadth Divergence captures the gap between how the index looks and how the average stock looks:
SBD = z(Price vs 200d) - z(% Stocks > 50d MA)When SBD exceeds +1.0, the index is outperforming the median stock by more than a standard deviation. That’s the “generals without soldiers” setup. Historically, SBD > +1.0 precedes meaningful pullbacks within 4-8 weeks about 70% of the time.
When SBD is below -1.0, the opposite is true: breadth is stronger than the index, which typically means the index is about to catch up in a rally.
The Consensus Trap
The consensus trap in market structure is the headline-price fallacy: “The market went up, so everything is fine.”
This week’s ceasefire rally was a case study. The S&P 500 surged 2.51% on Wednesday, then added another 0.62% on Thursday to close at 6,824, above both the 50-day and 200-day moving averages. The VIX dropped from ~27 to ~21. The Dow turned positive for the year. It felt like a regime change. But look beneath the surface:
Wednesday’s rally was concentrated in the most beaten-down names (energy, financials, tech). Thursday saw energy stocks sell off as oil climbed back toward $100. The rotation was erratic, not broad.
Breadth improved, but from deeply washed levels. Two days of participation is not a thrust.
The 200-day moving average was reclaimed on a news-driven gap, not a gradual build. Gap reclaims have lower persistence rates than grind-up reclaims.
Iran flagged ceasefire violations within 24 hours. Netanyahu said “there is no ceasefire in Lebanon.” The catalyst itself is fragile.
The consensus sees the reclaim and feels relief. The framework sees a reclaim that hasn’t been confirmed by breadth, momentum, or time. Those are very different things.
• • •
Where We Are Now
As of April 9, 2026 close:
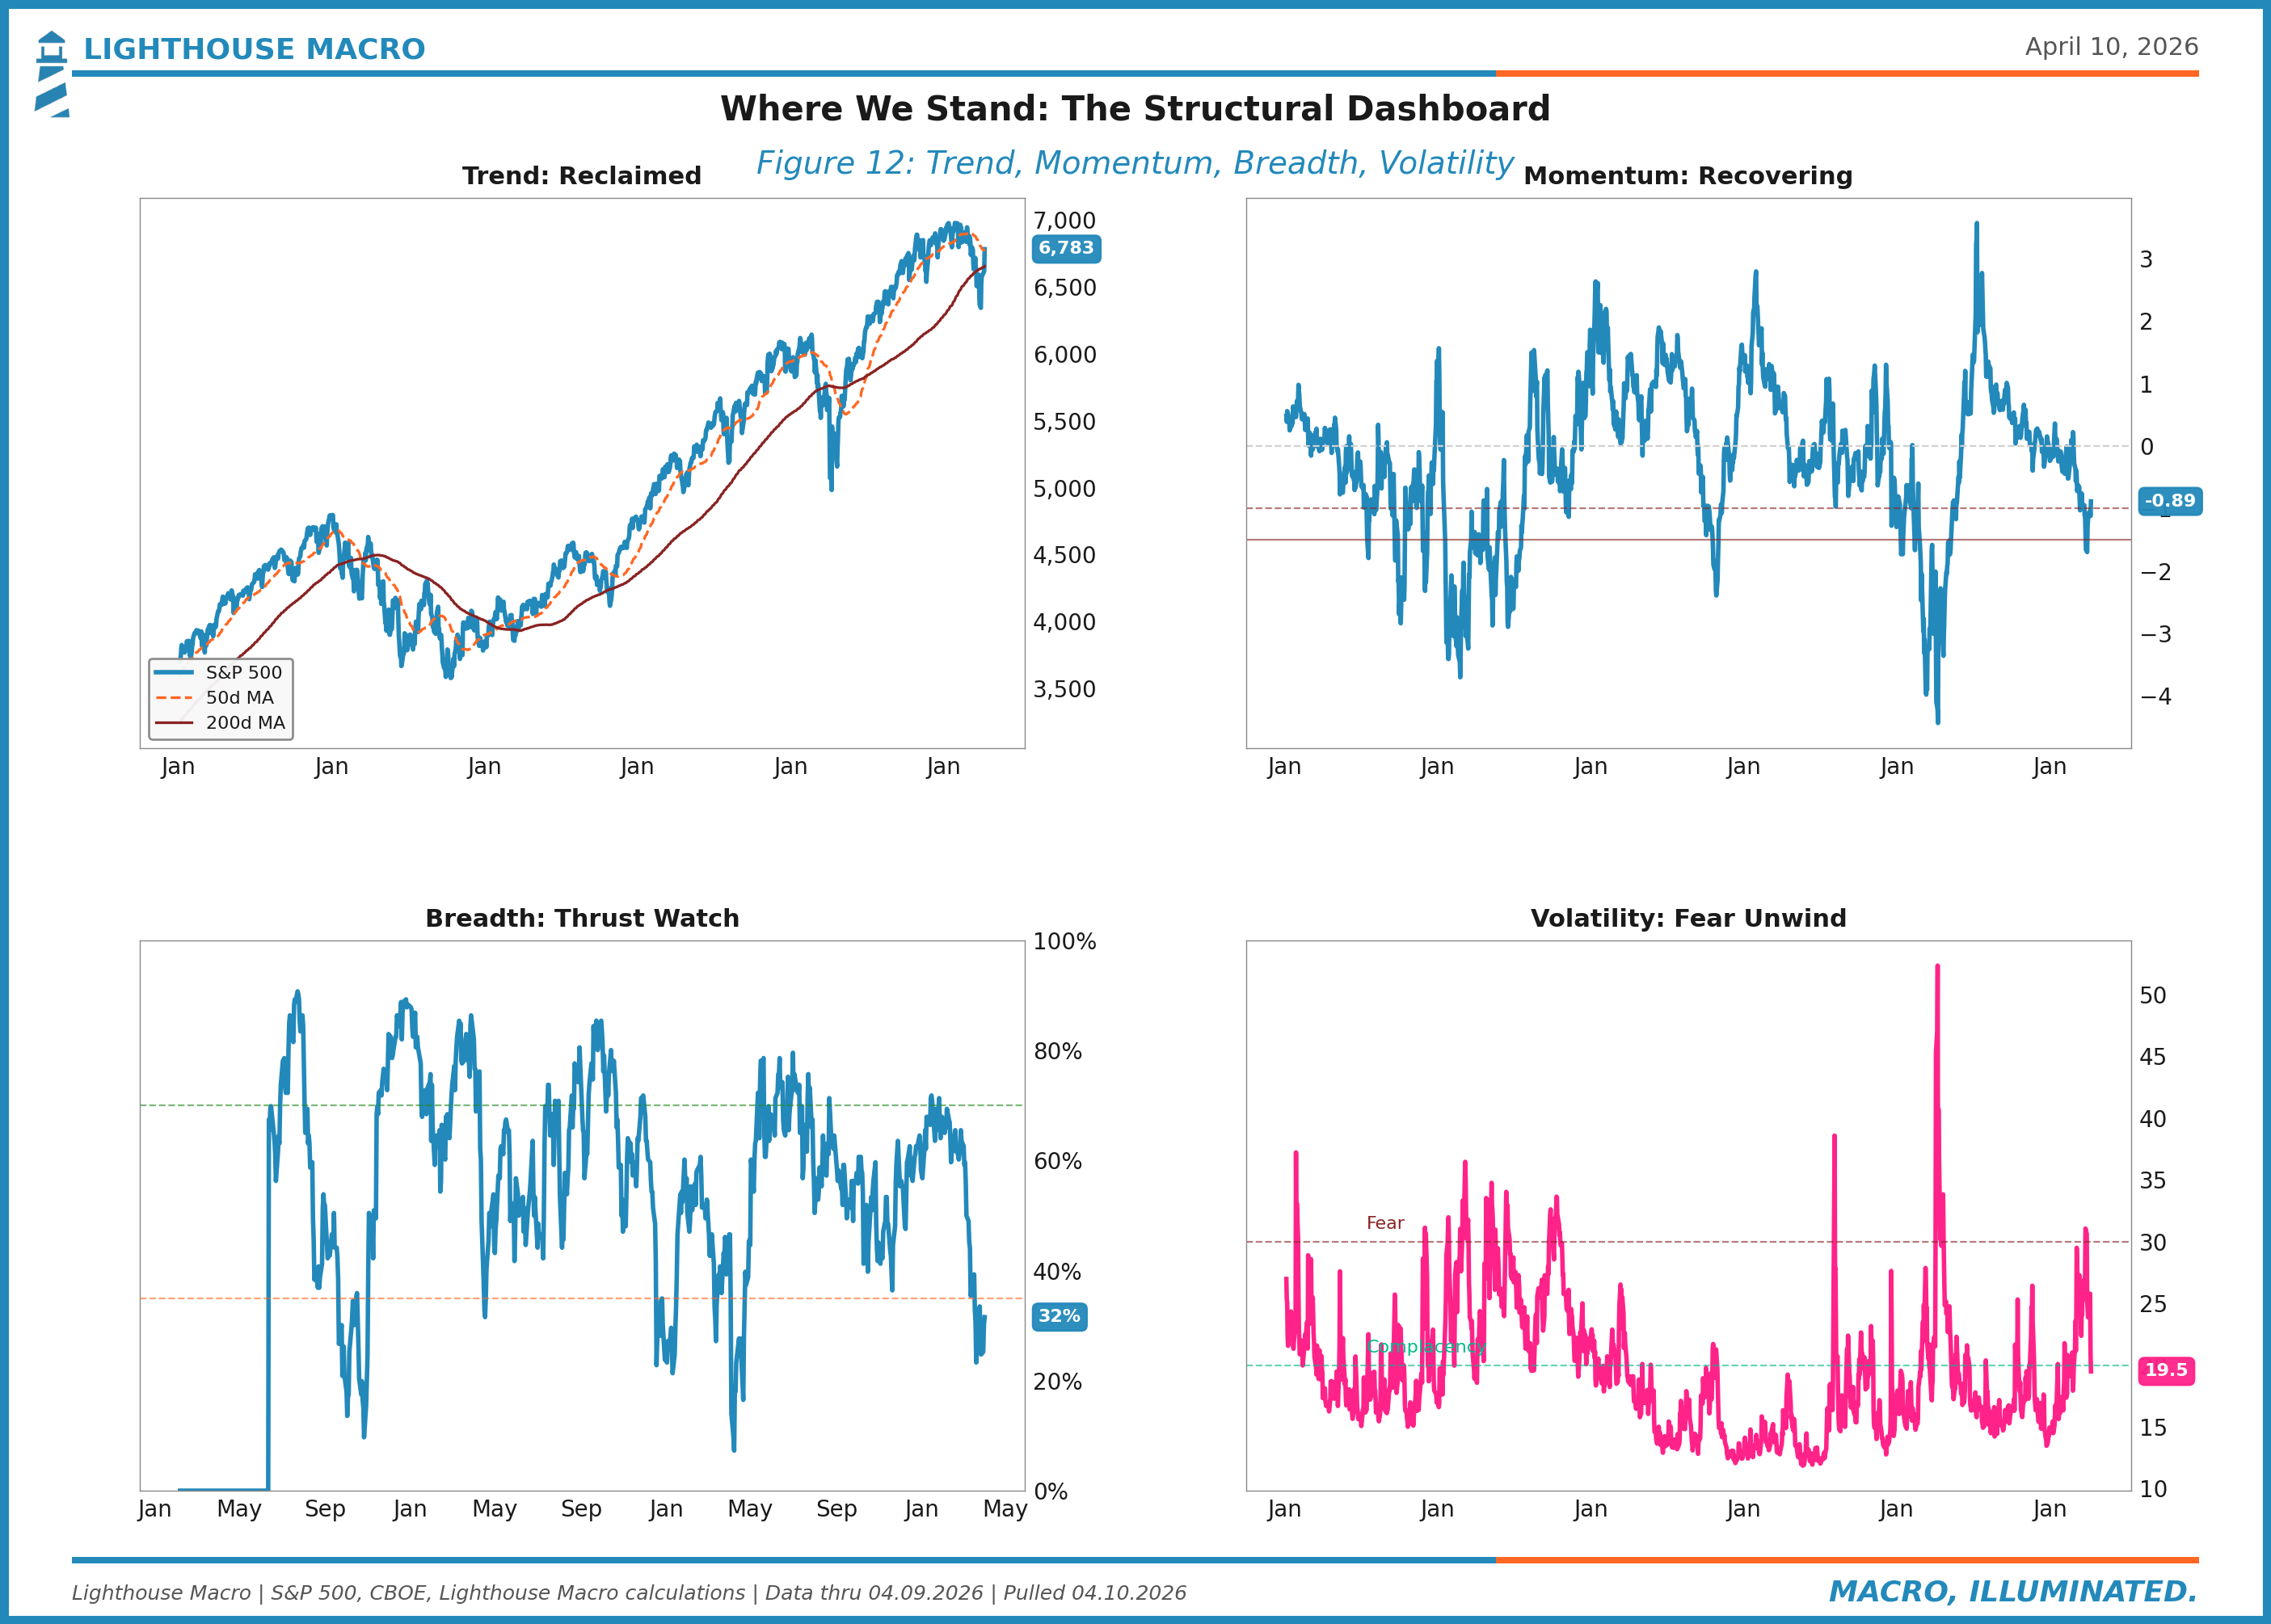
MSI: Negative, recovering sharply. The composite has improved significantly over the past seven sessions but remains below the levels it held before the March breakdown. Short-term components (20-day slope, short-term breadth) have flipped positive. Intermediate components are turning but not confirmed.
Trend: Reclaimed, not confirmed. The S&P 500 closed at 6,824.66, above both the 200-day MA (6,644) and the 50-day MA (6,784) for the first time since mid-March. This is constructive, but a reclaim on a gap-up needs 5+ sessions of holds to be considered structural rather than reactive. We’re on session two.
Momentum: Recovering. Z-RoC is still negative but rising. The seven-day winning streak has improved the trajectory. We need a zero-line cross and sustained positive readings to declare momentum repaired.
Breadth: Improved from washed, thrust watch active. % above 50-day MA has risen from the low 30s. We’re watching for the breadth thrust trigger: 30% to 70% in 10 sessions. If it fires, that’s one of the most reliable buy signals in equity markets. It hasn’t fired yet.
VIX: Compressed to ~21. Down from 27+ in late March. The speed of the compression is notable. Below 20 would enter complacency territory. For now, the drop is consistent with a fear unwind, which is healthy.
SBD: Compressing. The divergence between the index and the average stock has narrowed. This is constructive. If breadth continues improving faster than the index, the setup shifts from “generals without soldiers” to “soldiers catching up,” which is bullish.
The honest read: the structural picture has improved more in two sessions than it did in the preceding three weeks. That’s meaningful. But the improvement came from a single exogenous catalyst (the ceasefire) whose durability is actively being questioned. Iran says it’s been violated. Israel says Lebanon isn’t included. Oil is back at $98. The framework says: watch whether the reclaim holds, watch whether breadth thrusts, and don’t confuse a relief rally with a regime shift until the data confirms it.
How to Track
You don’t need a Bloomberg terminal:
Price vs. MAs: Any free charting platform (TradingView, StockCharts). Overlay the 50-day and 200-day on SPY.
% Above 50d MA: $SPXA50R on StockCharts, or search “S&P 500 percent above 50 day” on TradingView.
% Above 200d MA: $SPXA200R.
Advance-Decline Line: $ADD on most platforms.
New Highs - New Lows: $NYHL or HIGHL on TradingView. Apply a 20-day SMA.
McClellan Summation: $NYSI on StockCharts.
The real edge isn’t access. It’s discipline. Check these weekly. Build a routine. When they all say the same thing, act. When they conflict, wait.
• • •
Invalidation Criteria
The recovery case confirms if:
SPY holds above its 200-day MA (6,644) for 5+ consecutive sessions
% above 50-day MA triggers a breadth thrust (30% → 70% in 10 days)
Z-RoC crosses above zero and sustains for 2+ weeks
New highs begin to outnumber new lows on the 20-day MA
50-day MA slope inflects from negative to flat/positive
The recovery case fails if:
SPY falls back below the 200-day MA (6,644) on a closing basis
% above 50-day MA fails to push above 50% within two weeks
Z-RoC rolls over and makes a new low (below -1.5)
Ceasefire collapses, oil spikes above $110, and the gap gets filled
Advance-decline line diverges negatively from the index recovery
Both sides have explicit conditions. This isn’t a guess. It’s a framework with defined triggers.
• • •
Bottom Line
Market structure is the weight of evidence. Not one chart. Not one headline. Not one day’s price action. It’s the totality of trend, momentum, and breadth synthesized into a single question: is this market healthy, or isn’t it?
Right now, the answer is: recovering, reclaimed, and unconfirmed. Two sessions above two moving averages, driven by a ceasefire that’s already fraying. The short-term readings have improved. The intermediate structure hasn’t confirmed yet. We need follow-through, breadth participation, and time.
The MSI doesn’t tell you what will happen. It tells you where you stand and what would change the picture. That’s enough. In a market that mistakes a gap-up for a regime shift, clarity about the structural evidence is the edge.
Eleven pillars down. One to go.
This is Pillar 11 of the Diagnostic Dozen, a 12-part series breaking down the macro framework that powers everything we do at Lighthouse Macro. Next: Pillar 12, Sentiment.
Bob Sheehan, CFA, CMT | Founder & Chief Investment Officer
Lighthouse Macro | LighthouseMacro.com | @LHMacro
After a decade in commodity trading and risk management, this framework is the cleanest articulation I've seen of why headline reclaims need to be separated from structural confirmations. The "two sessions above two moving averages" framing captures exactly what most market commentary refuses to acknowledge during relief rallies.
One operational thread worth adding from the physical commodity side, because the ceasefire catalyst that drove this rally is the exact area where the structural fragility of the rally meets the structural fragility of the underlying narrative.
The ceasefire-driven gap that reclaimed the moving averages is being priced as if Hormuz tanker traffic resumes immediately on diplomatic resolution. The physical market signals tell a different story. War risk insurance for Hormuz transit operates on quarterly committee cycles at Lloyd's and the major P&I clubs. Even with a fully holding ceasefire, commercial insurance reinstatement typically takes 60-90 days because the underwriters need sustained evidence of corridor safety before authorizing coverage. During that lag, only state-backed and self-insured cargoes move freely. Commercial supply chains remain effectively constrained regardless of what diplomatic announcements suggest.
This matters for the market structure framework because the equity rally is implicitly pricing a near-term oil price normalization that the physical supply chain cannot deliver on the timeline equity markets are assuming. When dated Brent stays elevated and freight rates remain stretched even after diplomatic progress, the gap between paper market relief and physical market reality becomes the catalyst that tests whether the breadth thrust actually triggers or whether the rally fades back into the broader downtrend.
The watch item from the physical side that connects to the technical framework: if the breadth thrust window closes without firing while dated Brent stays above $130 and the dated Brent versus front-month futures spread remains above $20, the equity rally is likely pricing a resolution scenario that the supply chain cannot validate. That divergence resolves through equity weakness, not through commodity market normalization.