

From Foundations to Fault Lines: Part IV
The 5% Long Bond Is Back

Just shy of a year ago we asked whether the Treasury market's foundations were weakening. Twenty-four charts on what the answer turned out to be
In this series:
Part I: Cracks in the Foundations (Aug 12, 2025)
Part II: Collateral Fragility (Aug 19, 2025)
Part III: Seemingly Stable, Systemically Stressed (Sep 15, 2025)
Last August we asked whether the Treasury market’s foundations were weakening. A 10-year auction had just tailed for the first time in six months, and the question felt live. Since then the market has absorbed a war, a forced long-end liquidation, and the first 5% stops at a 30-year auction since 2007. I was in 8th grade the last time that happened.
With the FOMC next week and the quarterly refunding the week after, this felt like the right moment to take inventory. So we did, across auctions, funding, flows, supply, and the policy path.
Twenty-four charts. Here is what the tape says.
01
The Headline
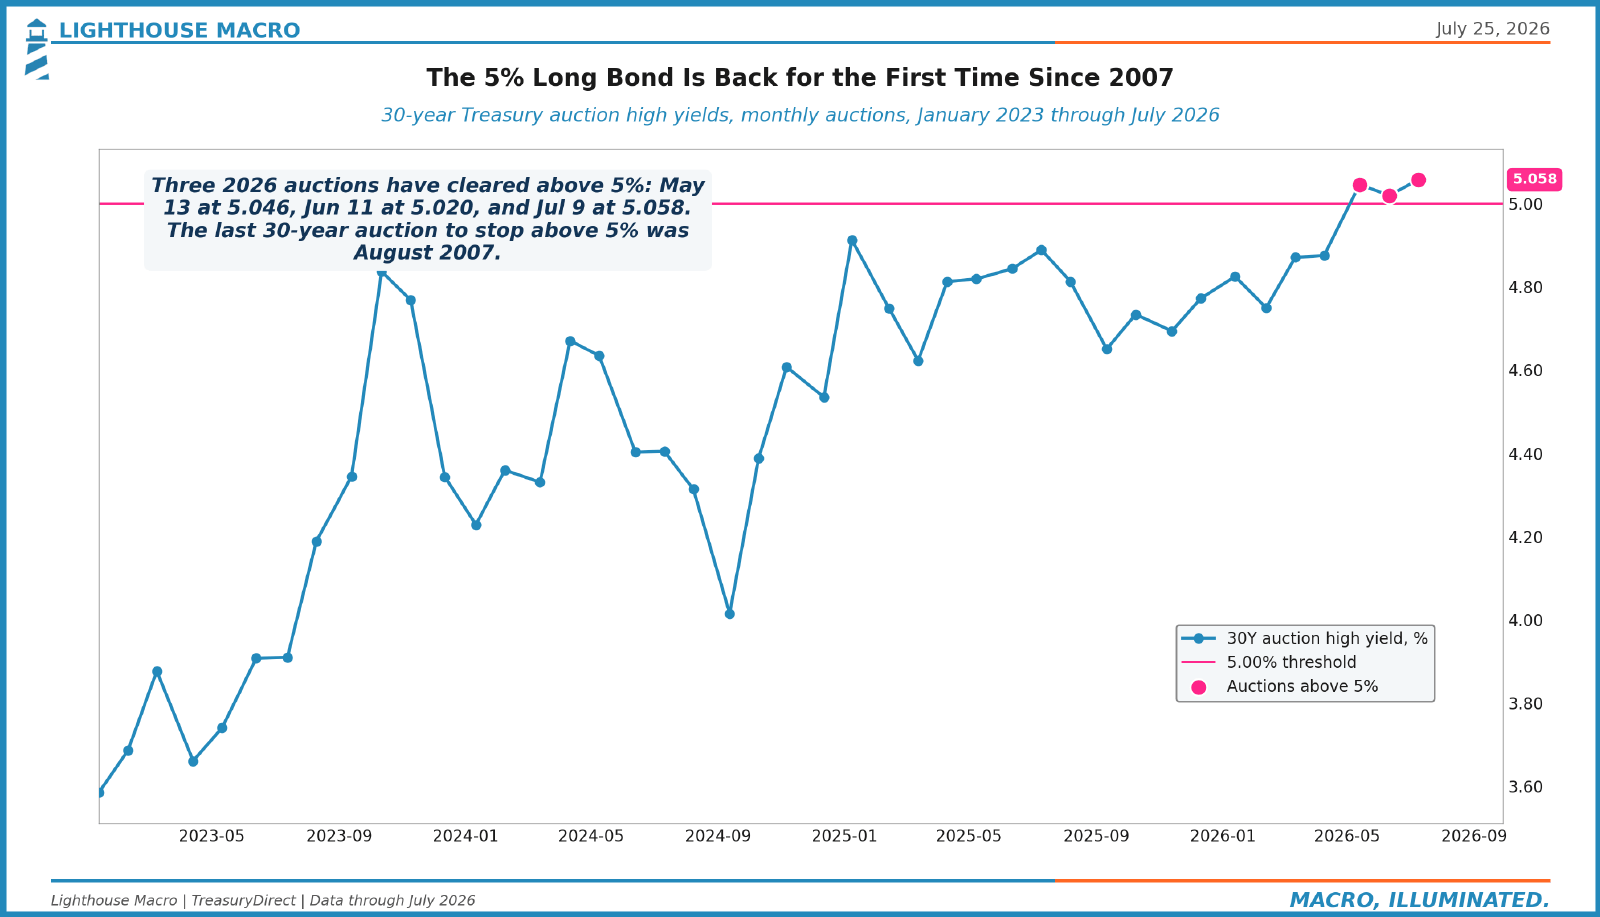
Three 30-year auctions have stopped above 5% this year: 5.046% in May, 5.020% in June, and 5.058% on July 9. The last auction to clear above the line was August 2007. Almost two decades between prints, then three in three months. The rest of this piece is about whether that yield is the sound of demand failing or the price of a repriced Fed. The tape says the second.
02
The Selloff Runs Through the Fed
Start with what actually moved.
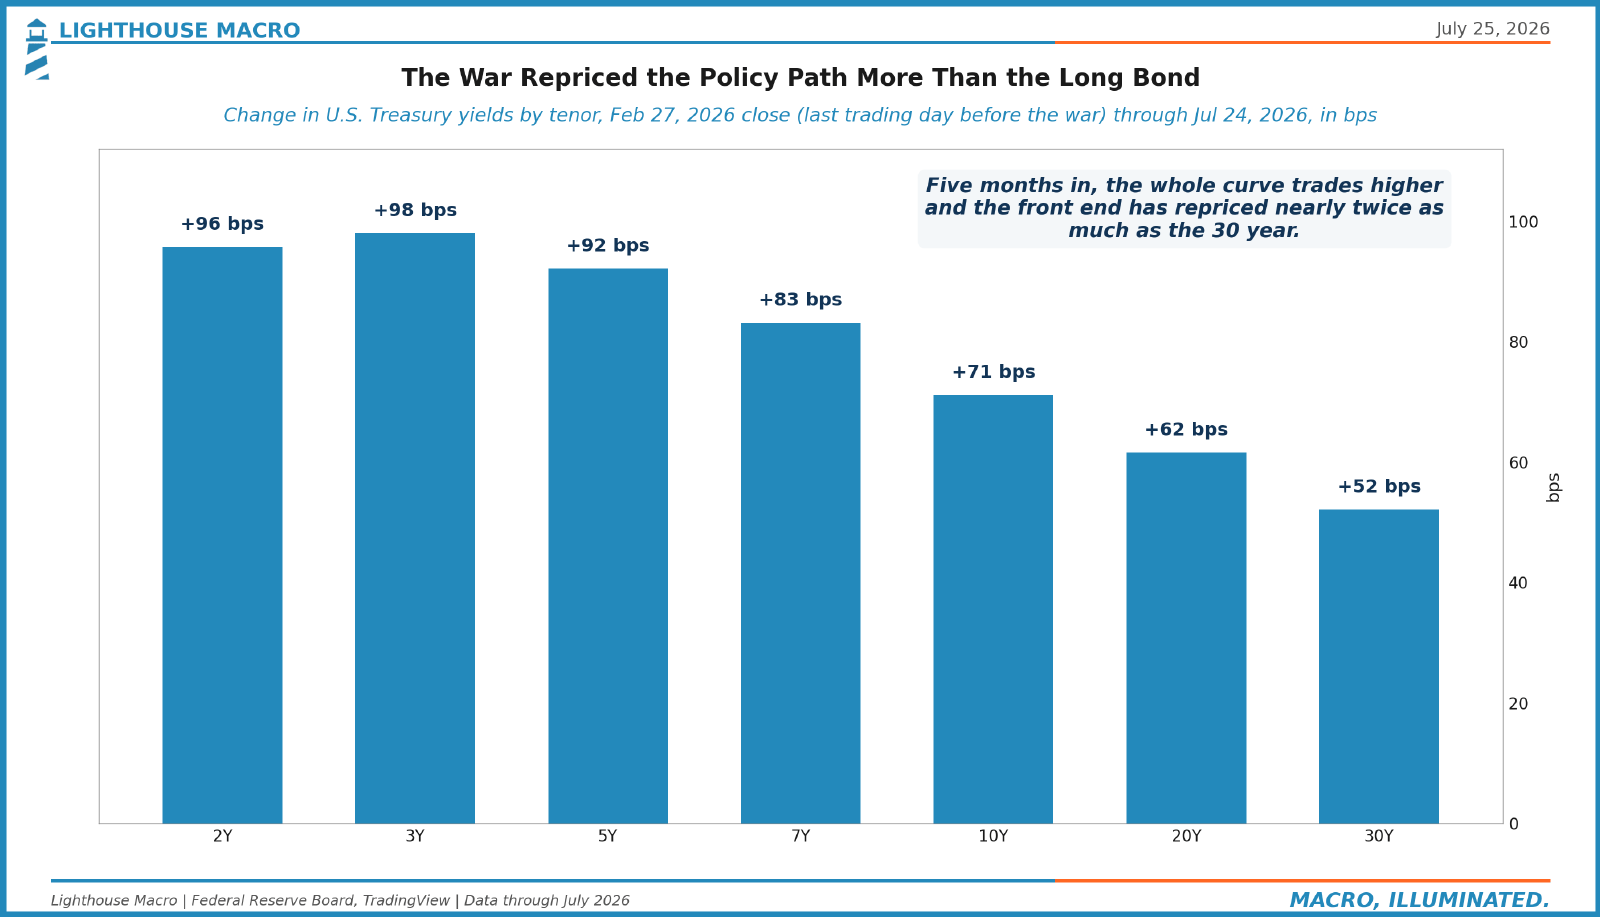
Five months of war, by tenor: the 2-year is up 96bps, the 3-year 98, the 10-year 71, the 30-year 52. The whole curve trades higher and the front end has repriced nearly twice as much as the long bond. That shape matters. A buyers’ strike or a supply scare shows up at the long end first. This one is concentrated where policy expectations live.
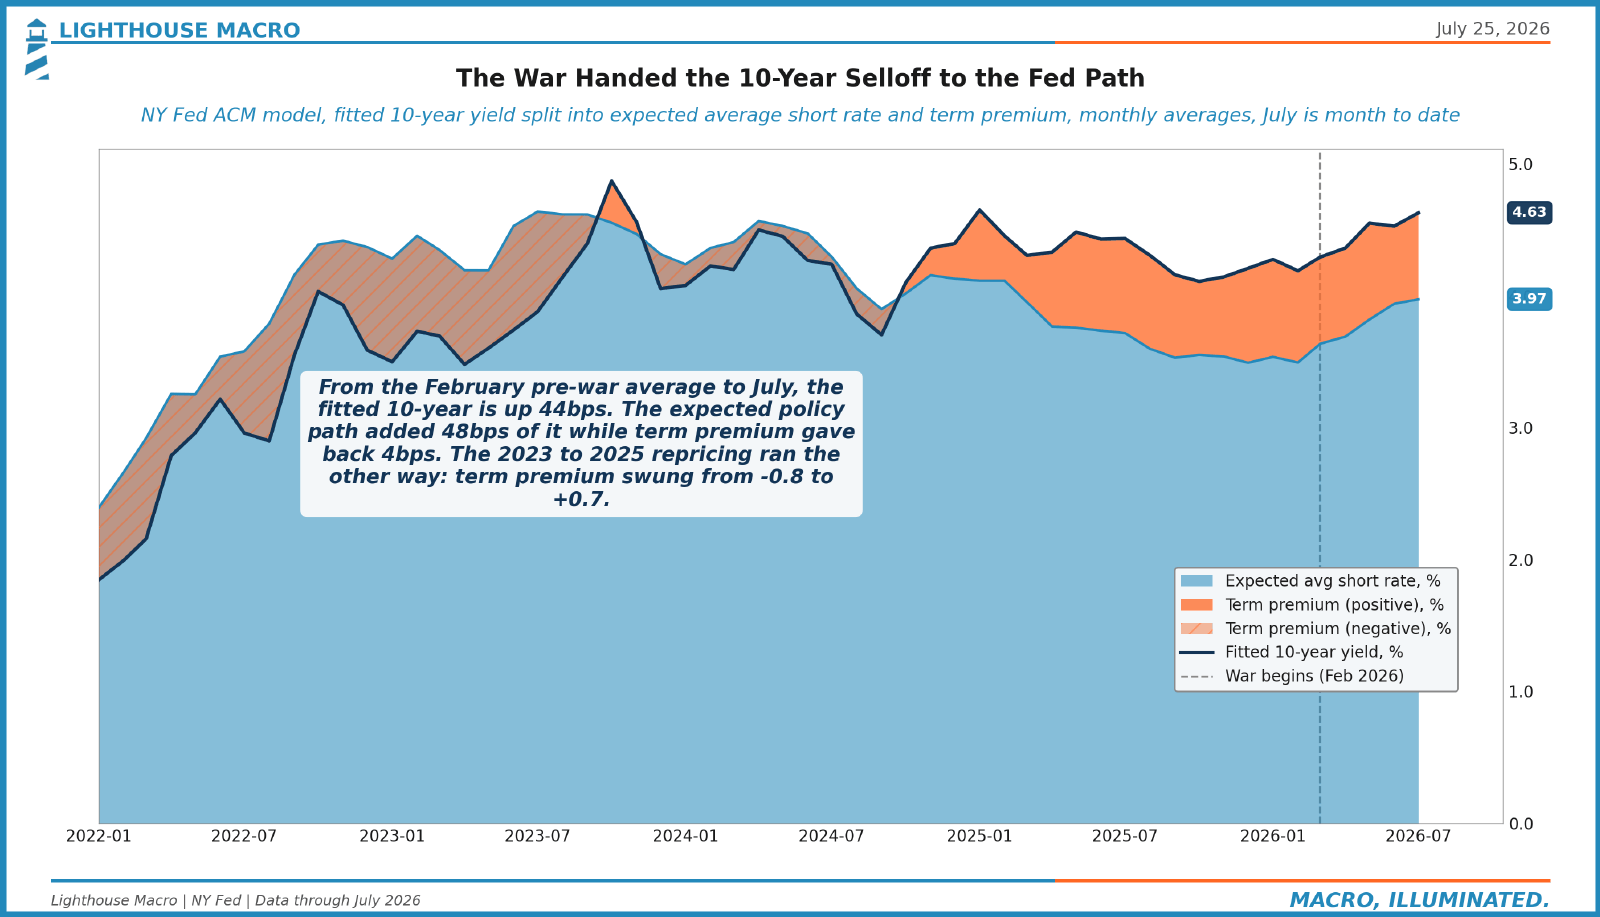
The NY Fed’s ACM model splits the 10-year move since February: the expected policy path added 48bps, term premium gave back 4. The 2023 to 2025 repricing ran the other way, with term premium swinging from -0.8 to +0.7. That episode was about compensation for holding duration. This one is about the path of rates.
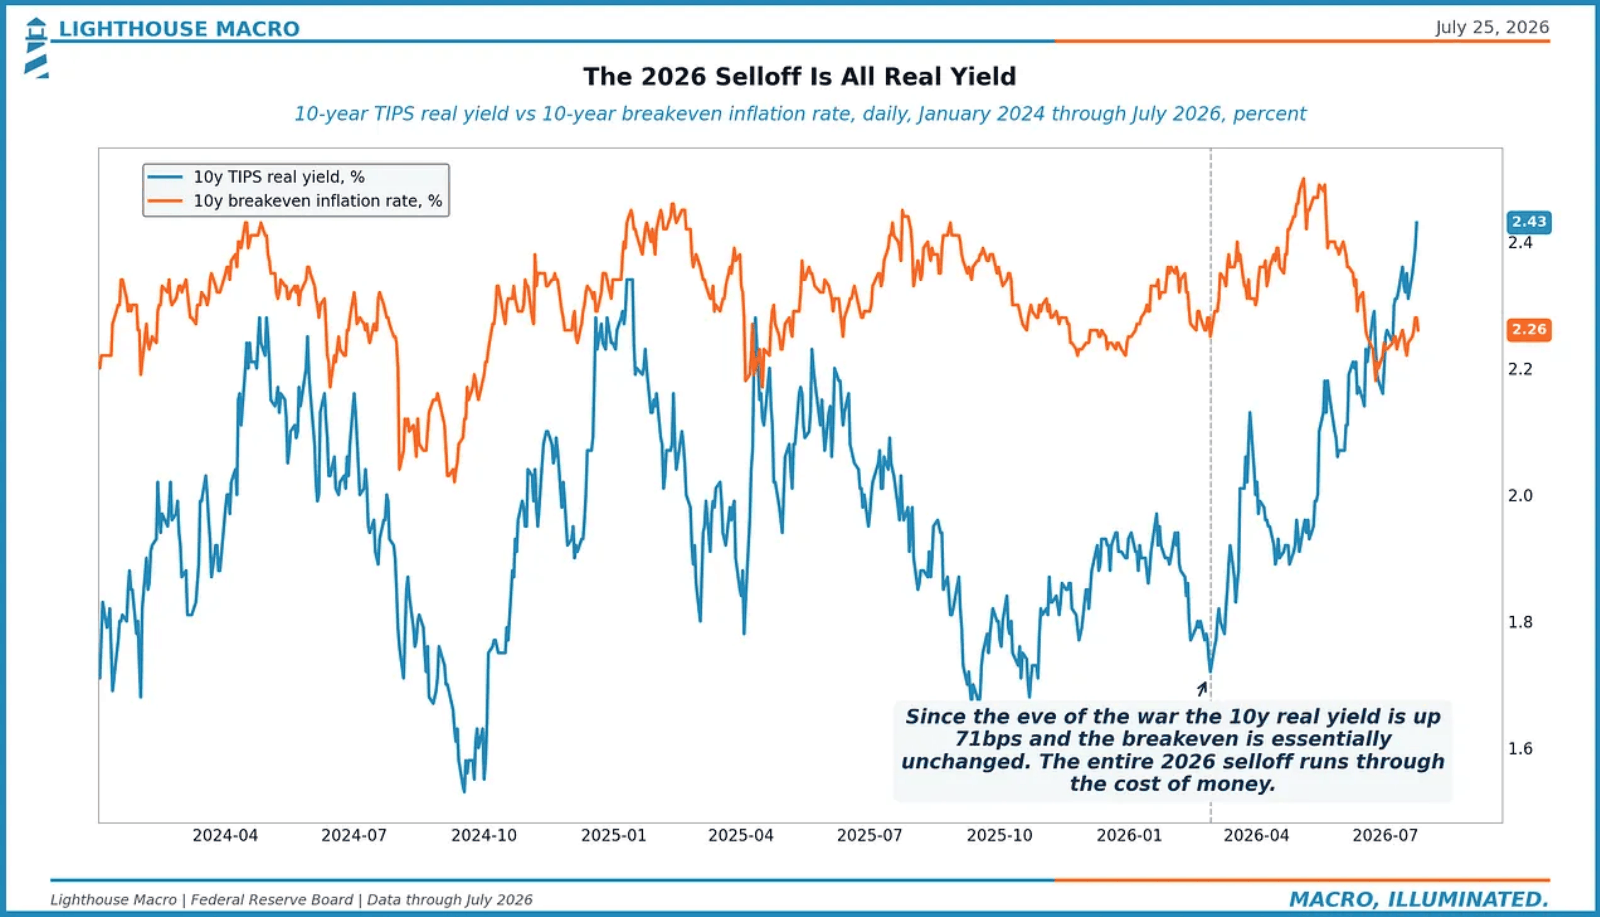
The TIPS market says the same thing. Since the eve of the war the 10-year real yield is up 71bps and the breakeven is essentially unchanged. No risk premium bleed. No de-anchoring. The entire 2026 selloff runs through the cost of money.
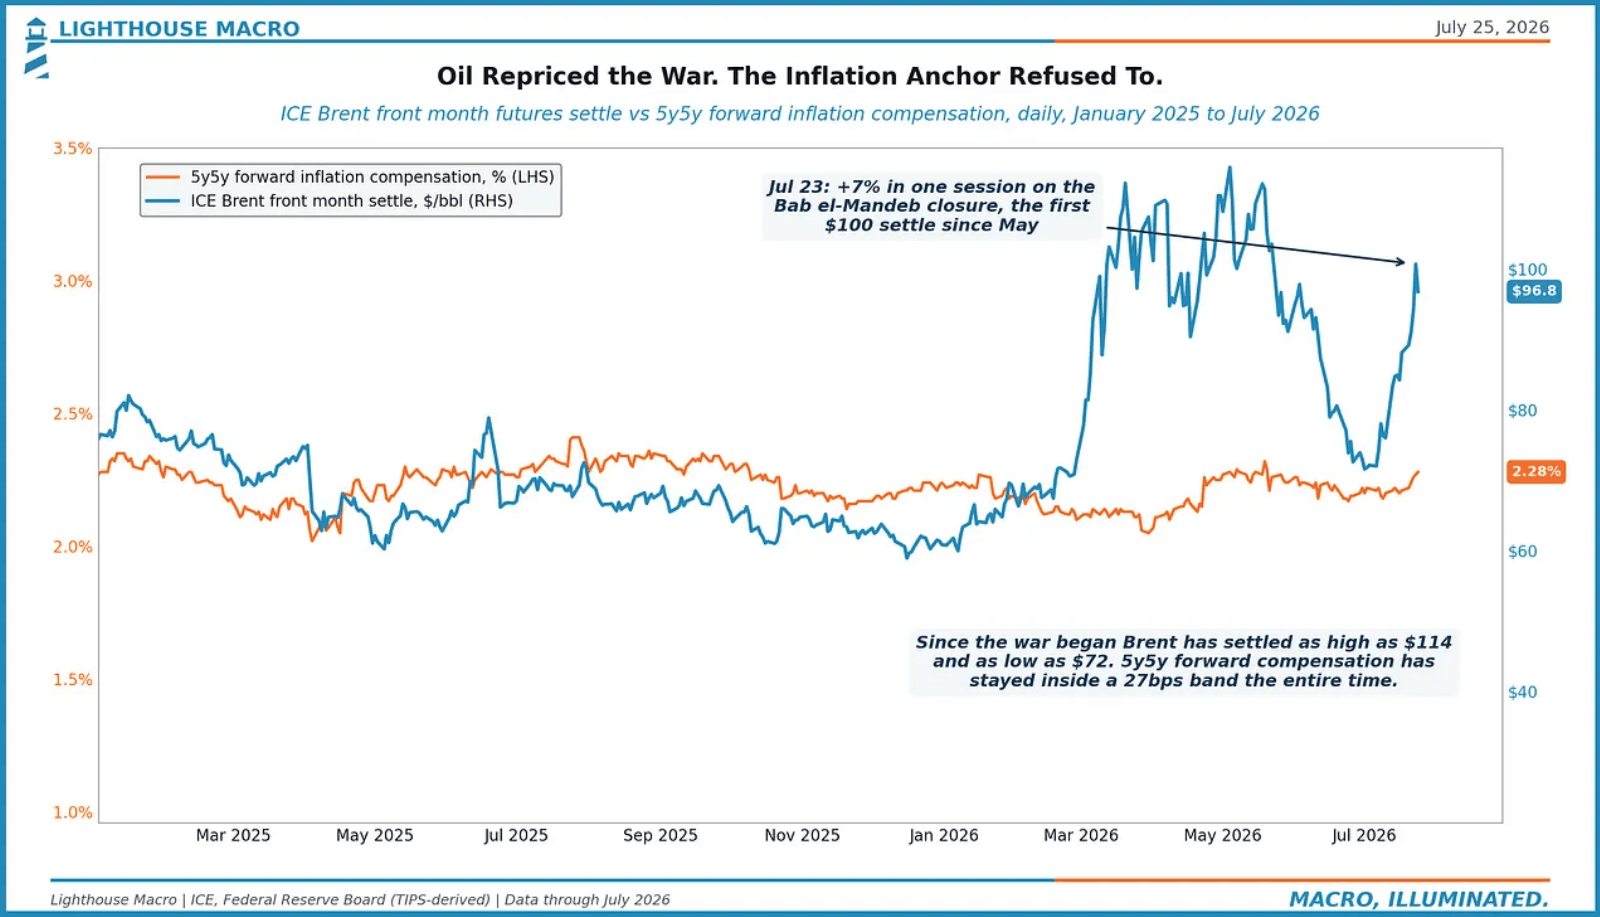
And the anchor has been tested for real. Brent settled above $100 on July 23 after the Bab el-Mandeb closure, up 7% in a session, and has ranged from $72 to $114 since the war began. 5y5y forward inflation compensation has stayed inside a 27bps band the whole time. Oil repriced the war. The anchor refused to.
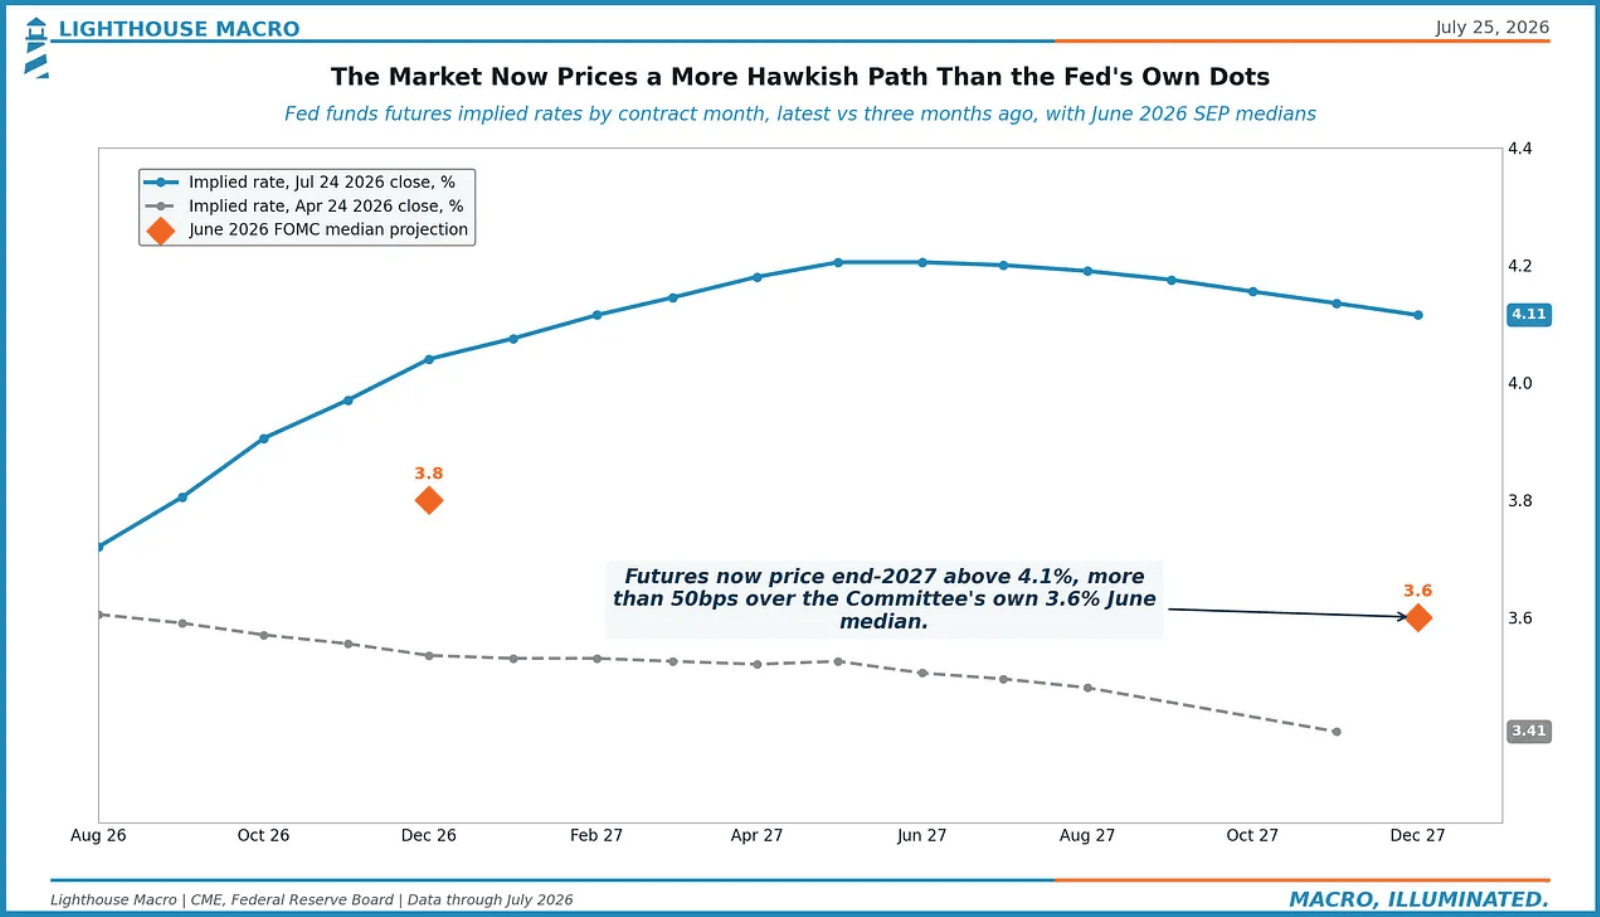
The market has pushed this further than the Fed itself. Fed funds futures now price end-2027 above 4.1% against the Committee’s own June median of 3.6%. More than 50bps of daylight, two years out.
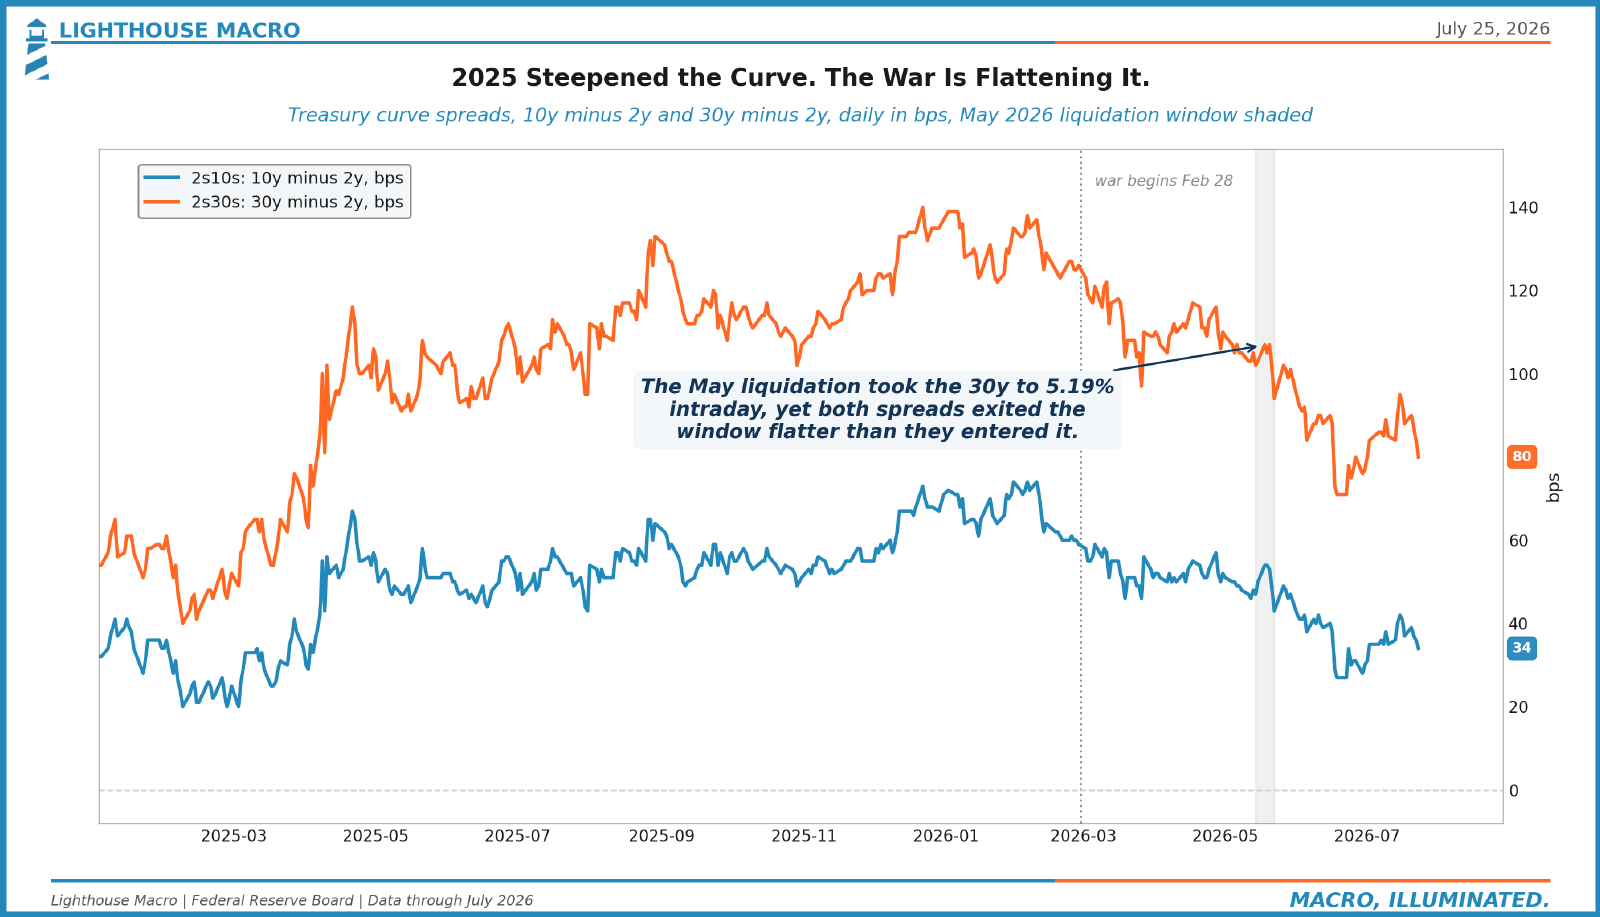
The curve agrees. The May liquidation took the 30-year to 5.19% intraday, yet both 2s10s and 2s30s exited that window flatter than they entered it. 2025 steepened the curve. The war is flattening it.
03
Demand Bent. It Has Not Broken.
If 5% were a demand problem, the auction tape would show it.
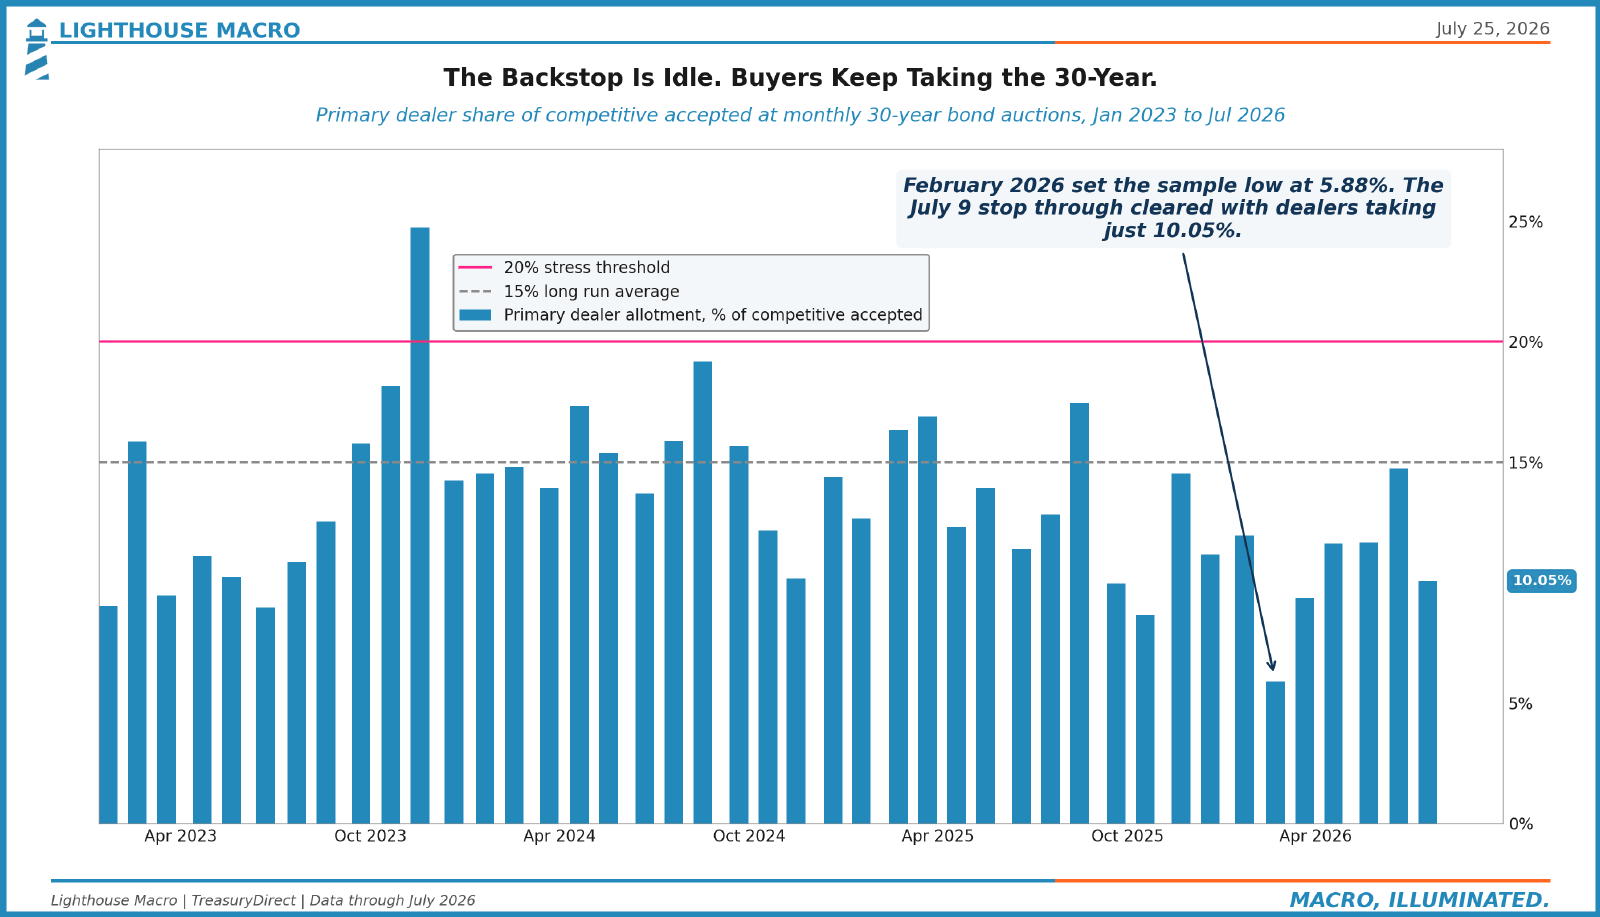
Forty-three monthly 30-year auctions on one chart. The 2023 tantrum forced dealers to swallow almost 25% of the auction. All three of this year’s 5% auctions cleared with dealer takedown under 15%. Higher yields, same depth of demand.
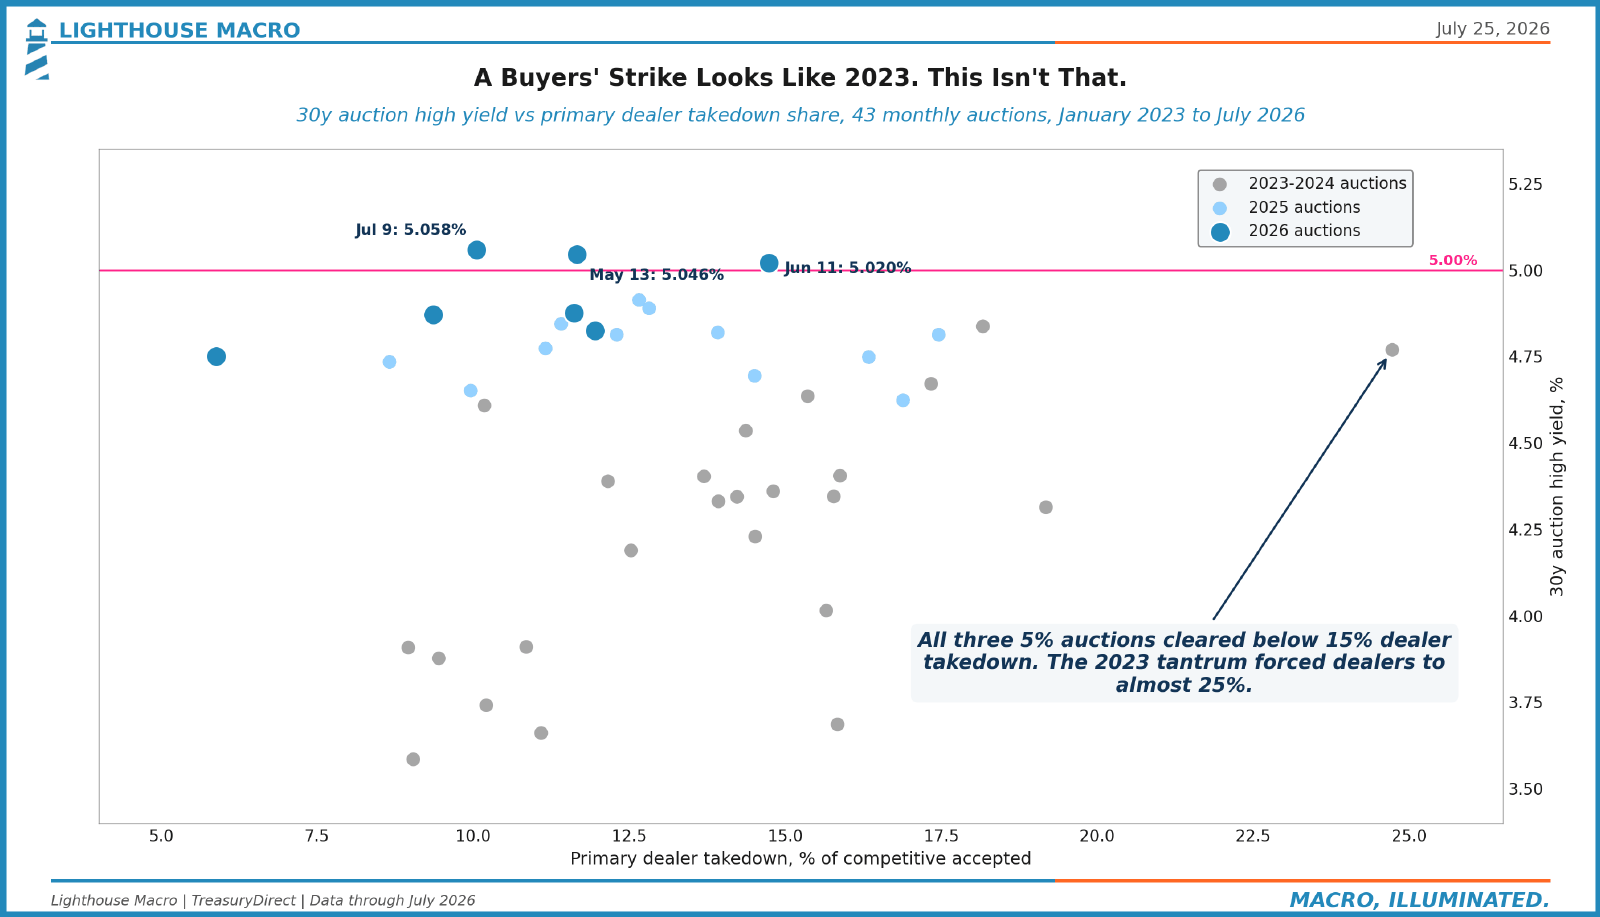
July’s auction stopped through with dealers taking just 10.05%. February set the sample low at 5.88%. The 20% stress threshold has not been touched since the 2023 tantrum. The backstop is idle because buyers keep showing up.
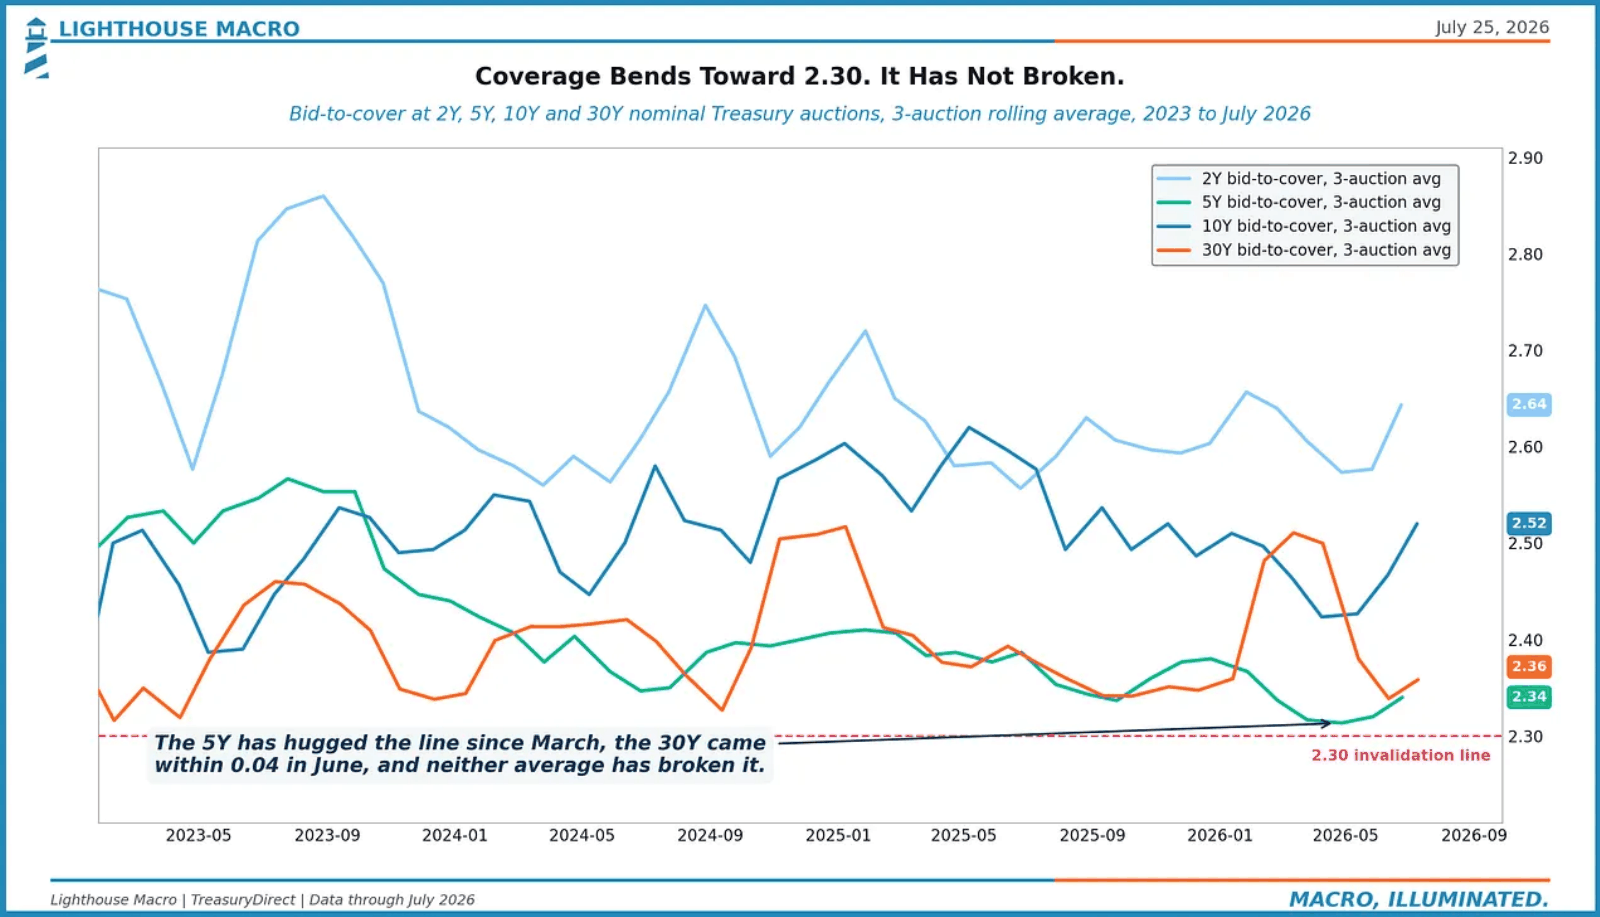
Coverage adds the nuance. Our invalidation line for the demand story is a 2.30 bid-to-cover. The 5-year has hugged it since March, the 30-year came within 0.04 in June, and neither 3-auction average has broken it. Bending is worth watching. It is not breaking.
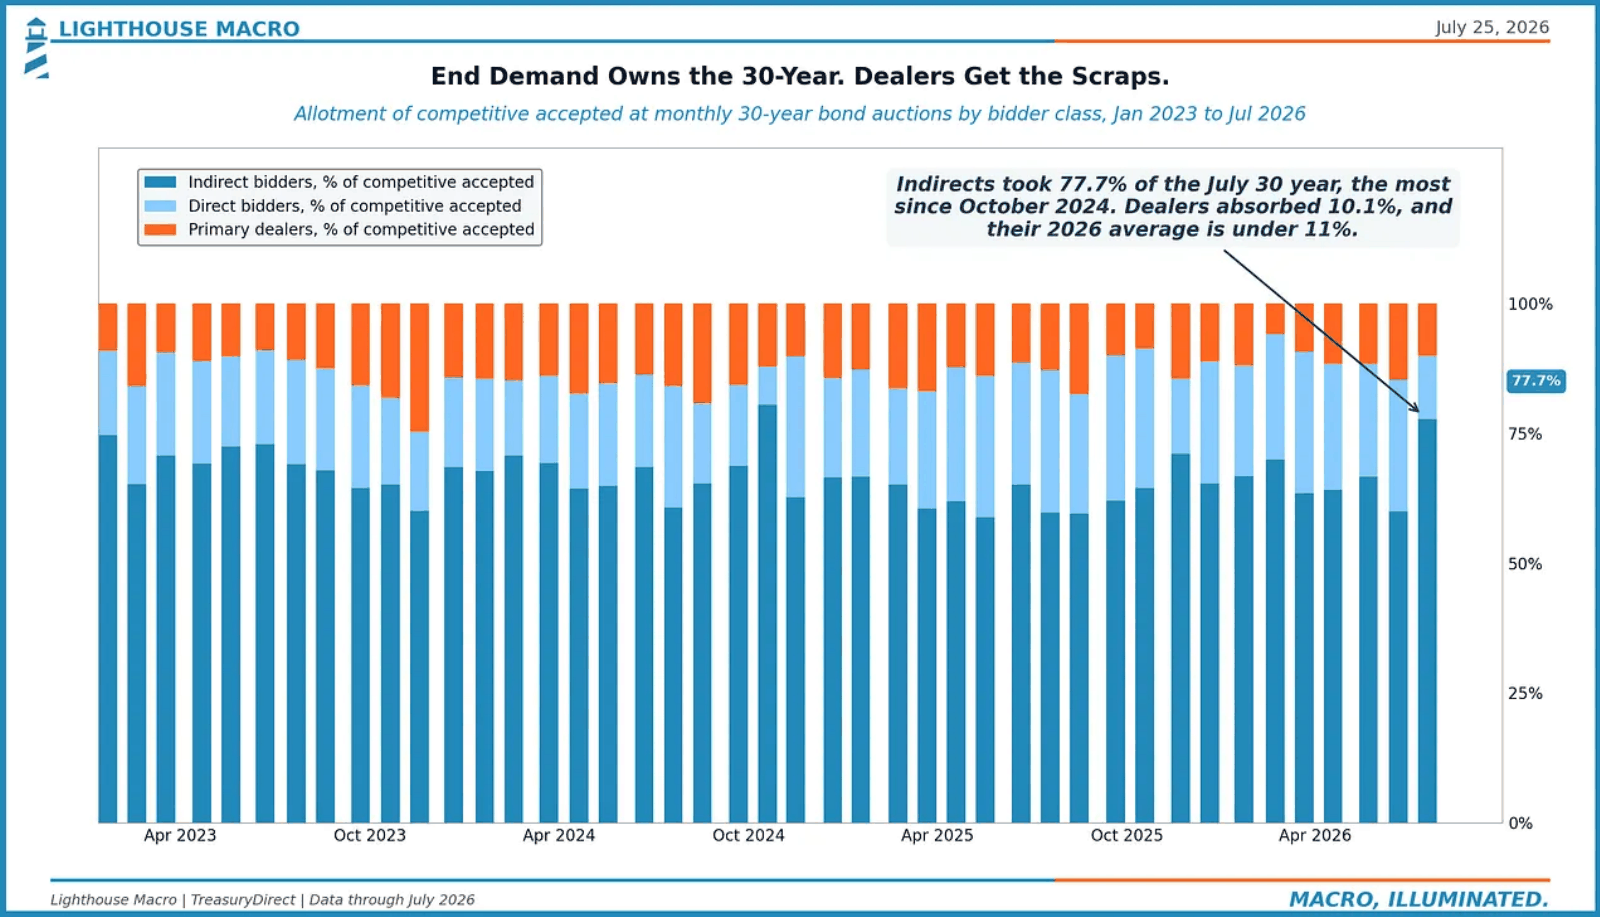
And the buyers doing the absorbing are the ones you want. Indirects took 77.7% of the July 30-year, the most since October 2024. Dealers absorbed 10.1% and their 2026 average is under 11%. End demand owns this market. Dealers get the scraps.
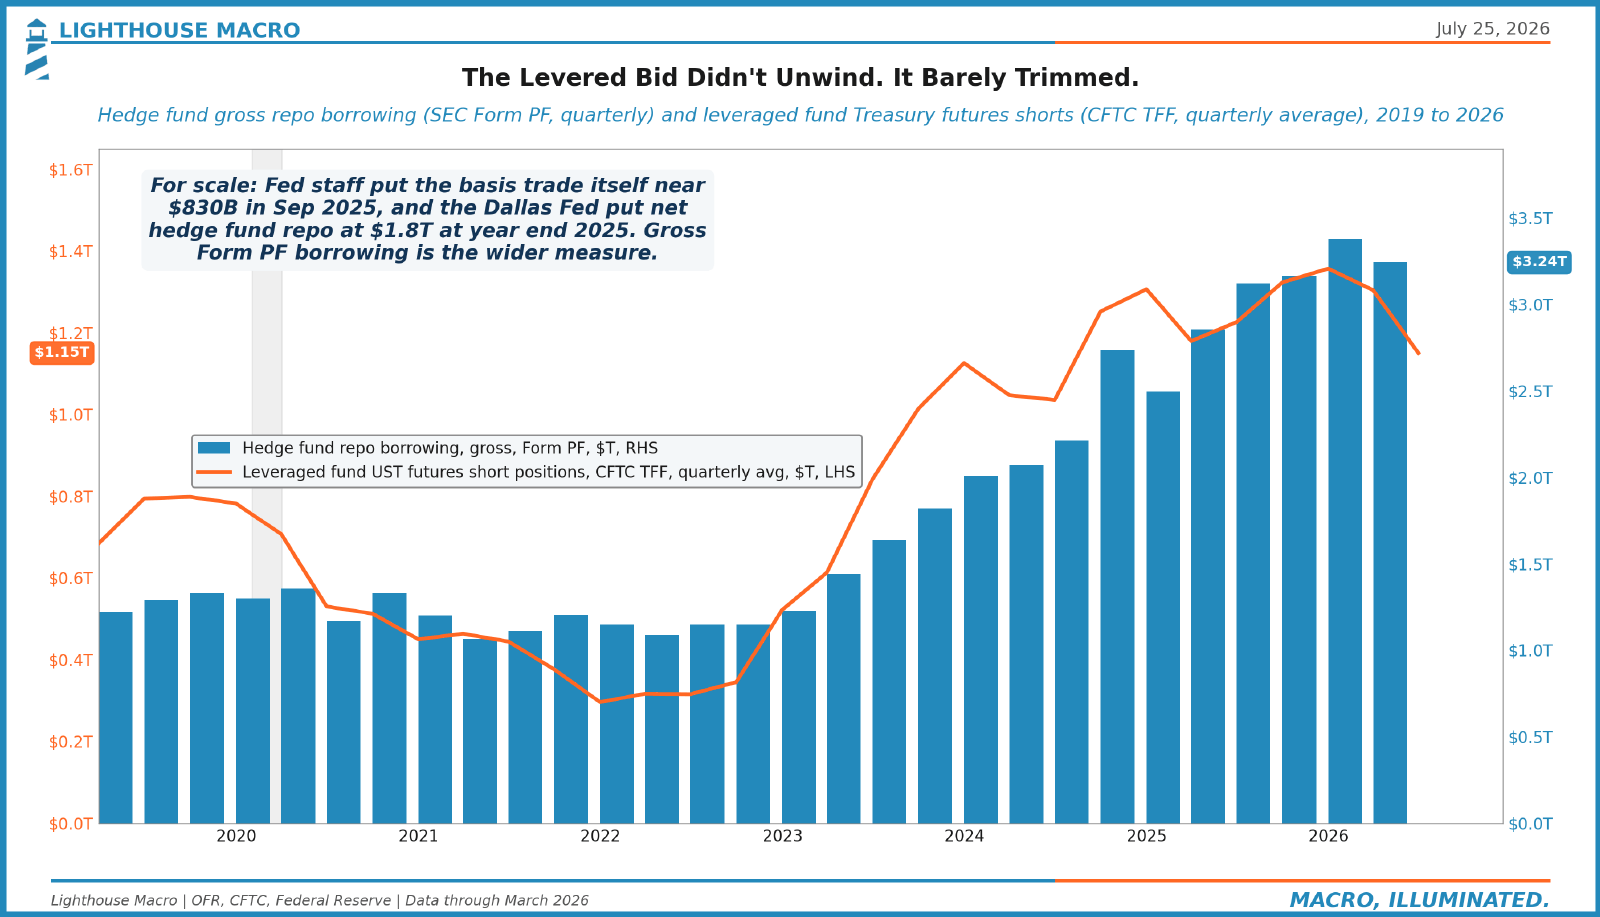
Even the bid everyone worries about held. Hedge fund gross repo borrowing sits at $3.24T and leveraged fund Treasury futures shorts at $1.15T. Through the war and the May liquidation, the levered bid barely trimmed. For scale, Fed staff put the basis trade itself near $830B last September and the Dallas Fed put net hedge fund repo at $1.8T at year-end 2025.
04
The Foreign Bid Changed Hands
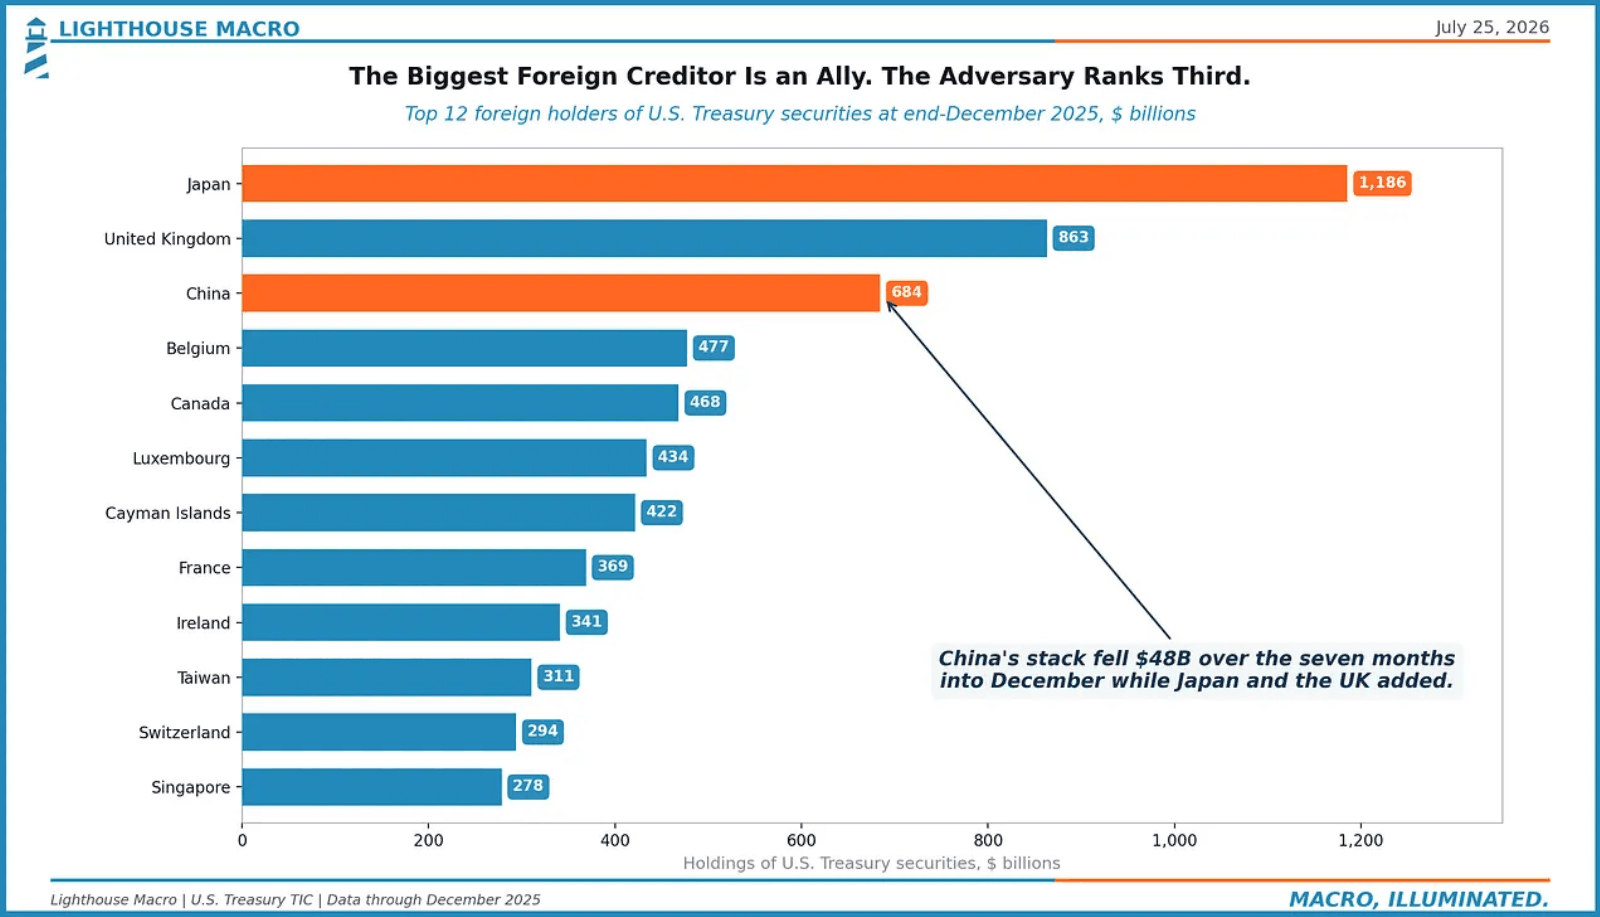
The holder table, end of December: Japan $1.19T, the UK $863B, China third at $684B. China’s stack fell $48B over the seven months into December while the other two added. The biggest foreign creditor is an ally. The adversary ranks third.
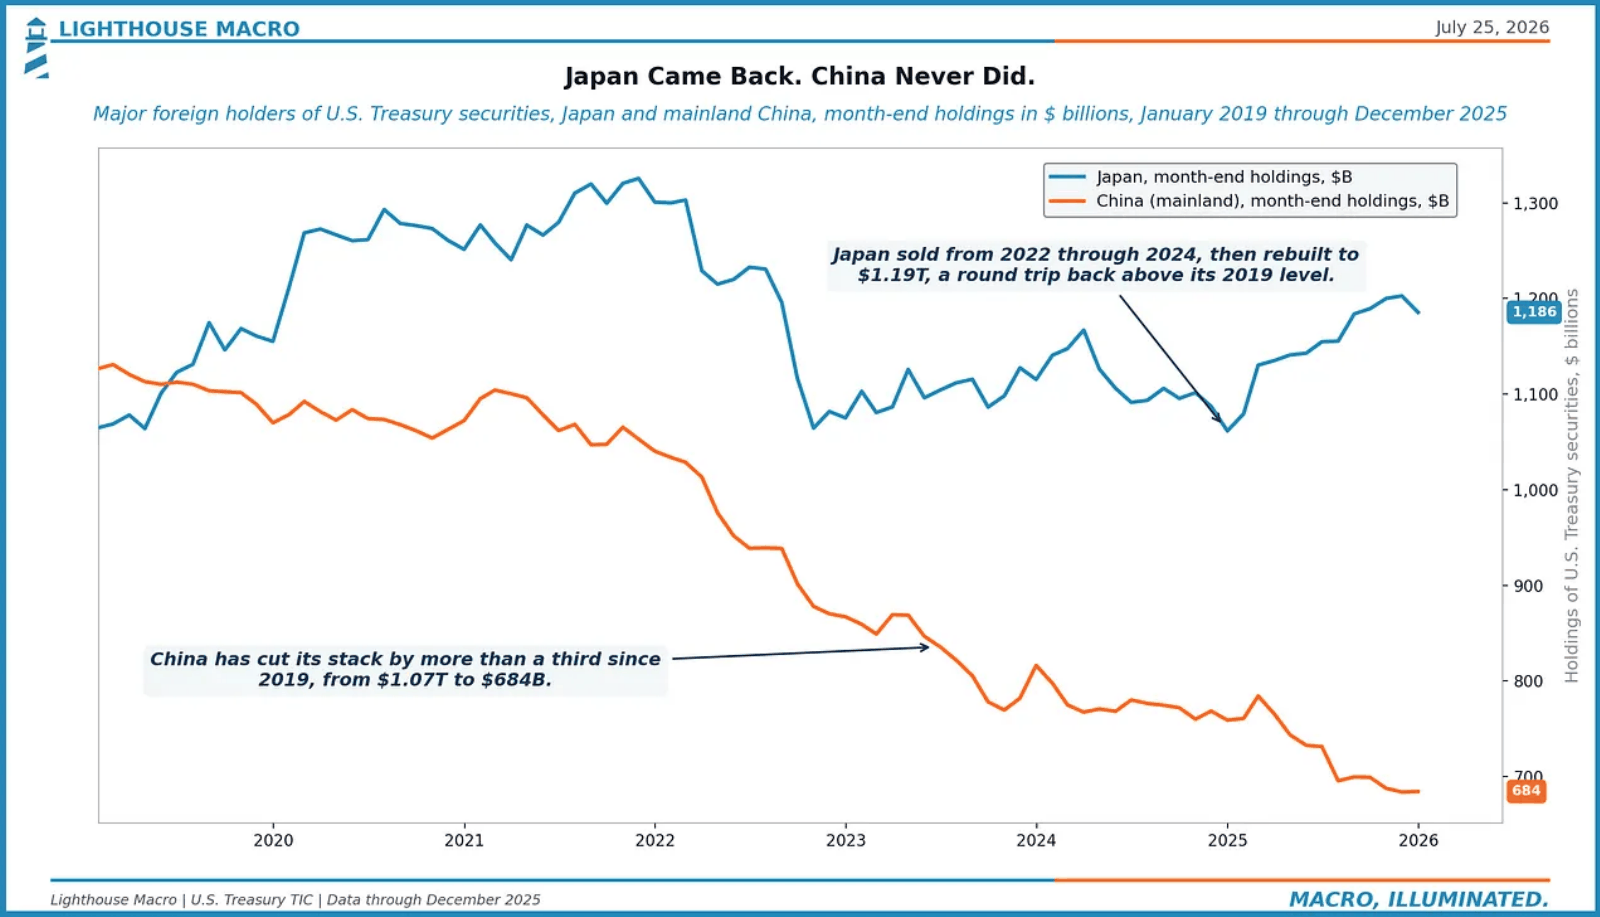
The longer arc is starker. Japan sold from 2022 through 2024, then rebuilt to $1.19T, back above its 2019 level. China has cut its stack by more than a third since 2019, from $1.07T to $684B. Japan took a roundtrip; China bought a one-way ticket.
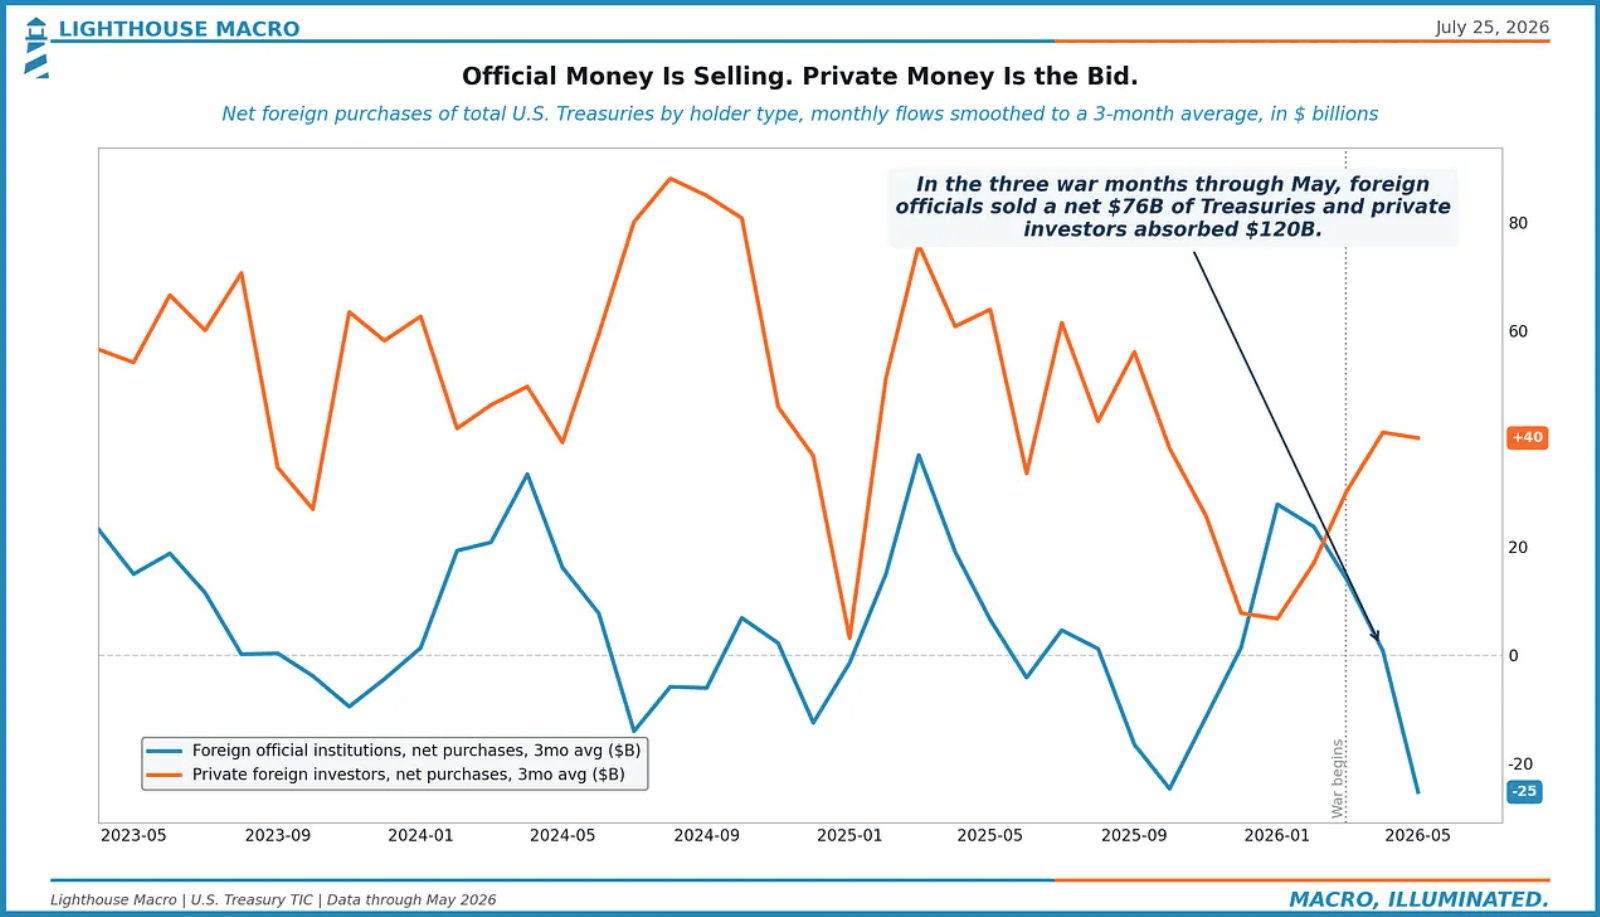
The war accelerated the rotation without breaking the bid. In the three war months through May, foreign officials sold a net $76B of Treasuries and private foreign investors absorbed $120B. Official money is selling. Private money is the bid. So far, the private bid is outpacing the sales.
05
The Cash Never Left
Now the plumbing, which is where we spent most of last year’s thread.
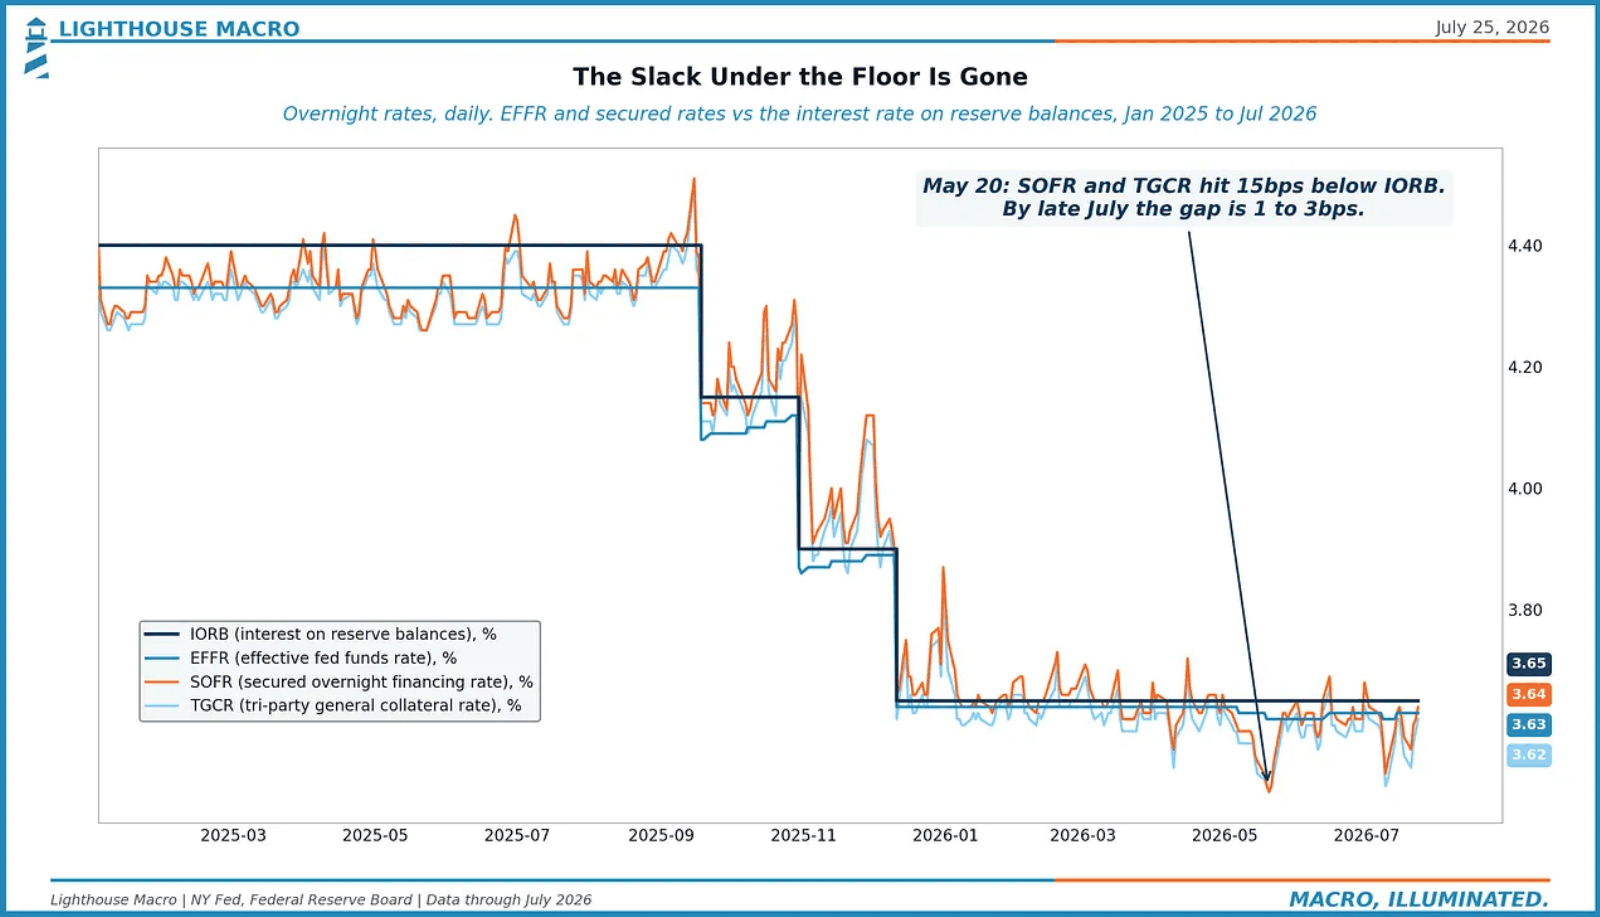
At the height of May’s long-end liquidation, repo cleared 15bps below the Fed’s floor. Duration was getting dumped into a market flush with cash. Cheap lighter fluid for all. Whatever May was, it was not a funding accident.
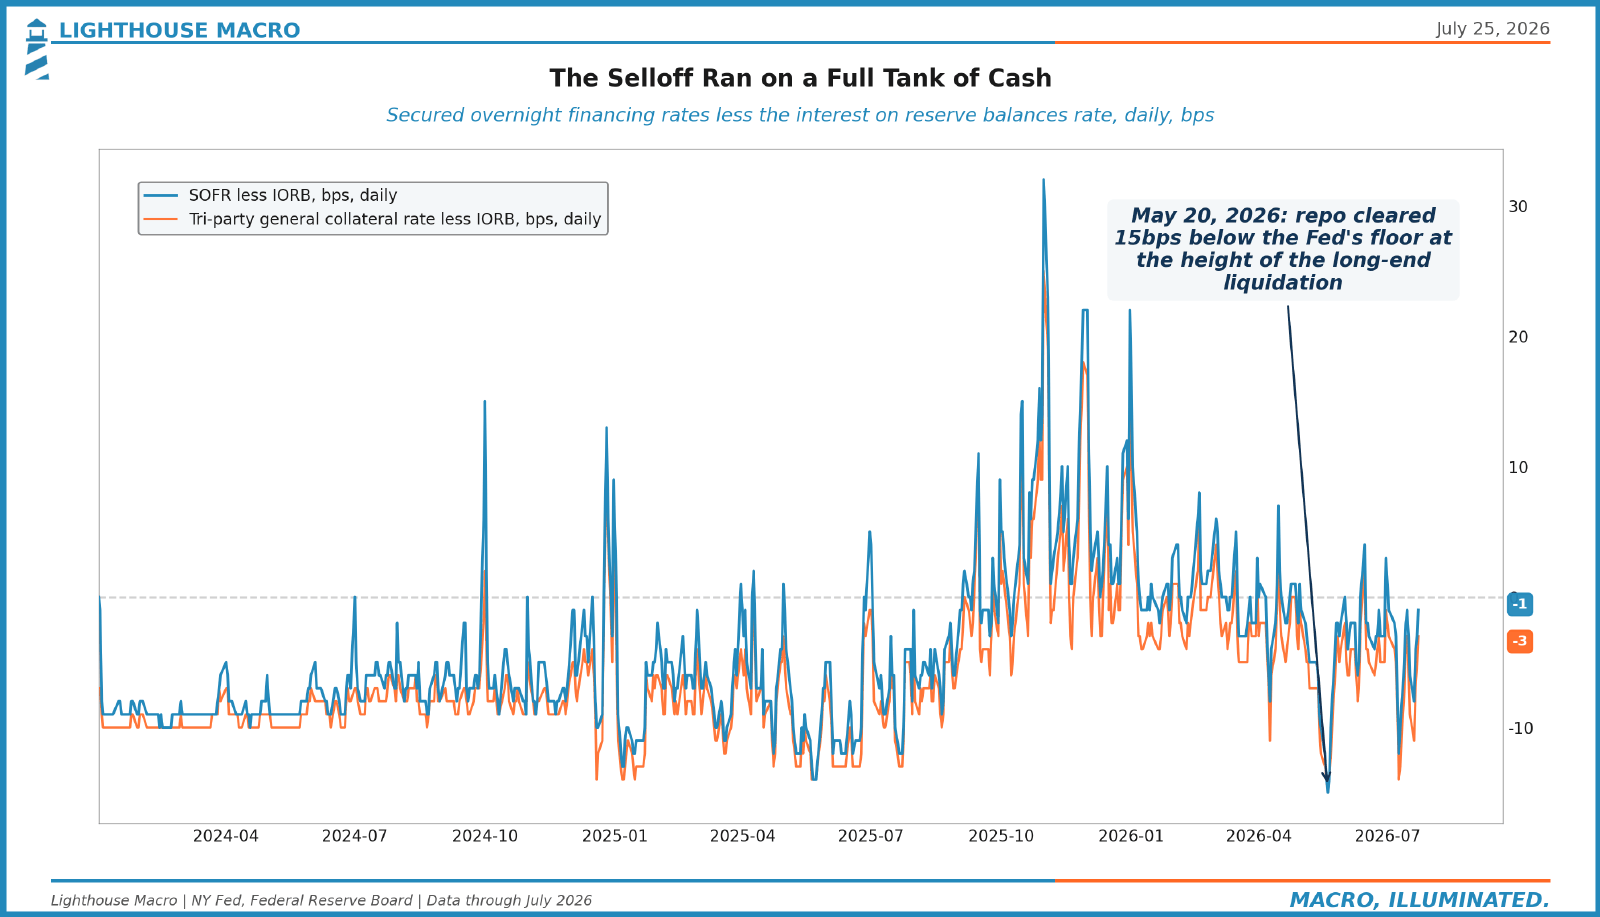
The slack is another story. On May 20, SOFR and TGCR printed 15bps below IORB. By late July the gap is 1 to 3bps. The cushion under the floor has been absorbed.
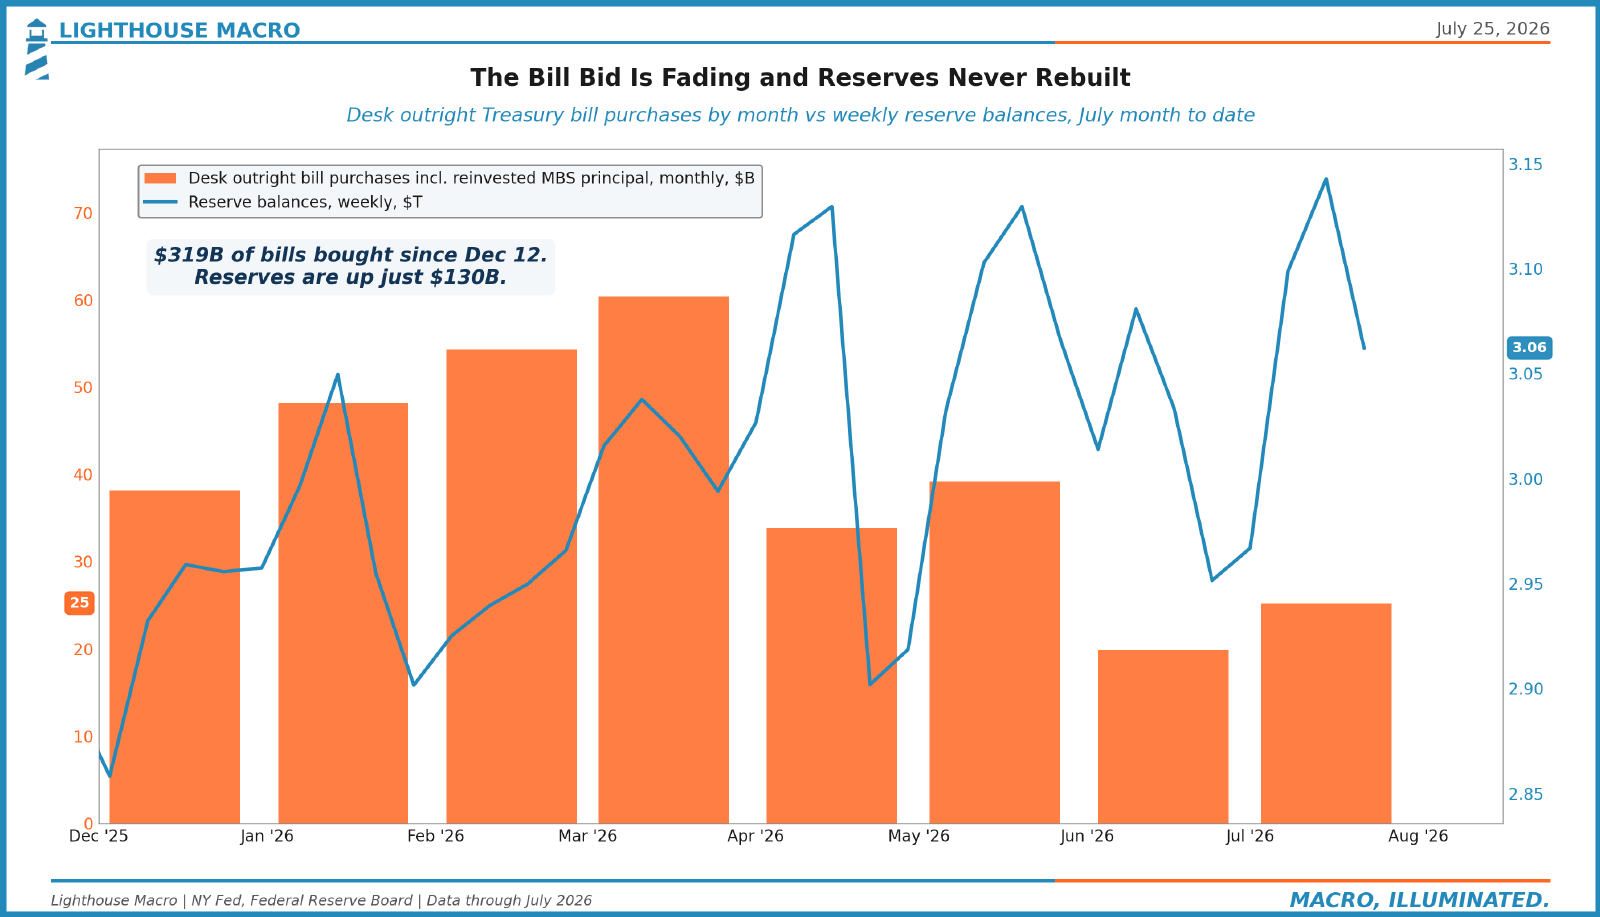
The rebuild keeps disappointing too. The Desk has bought $319B of bills since December 12. Reserves are up just $130B. The bill bid is fading and reserves still need more cushion.
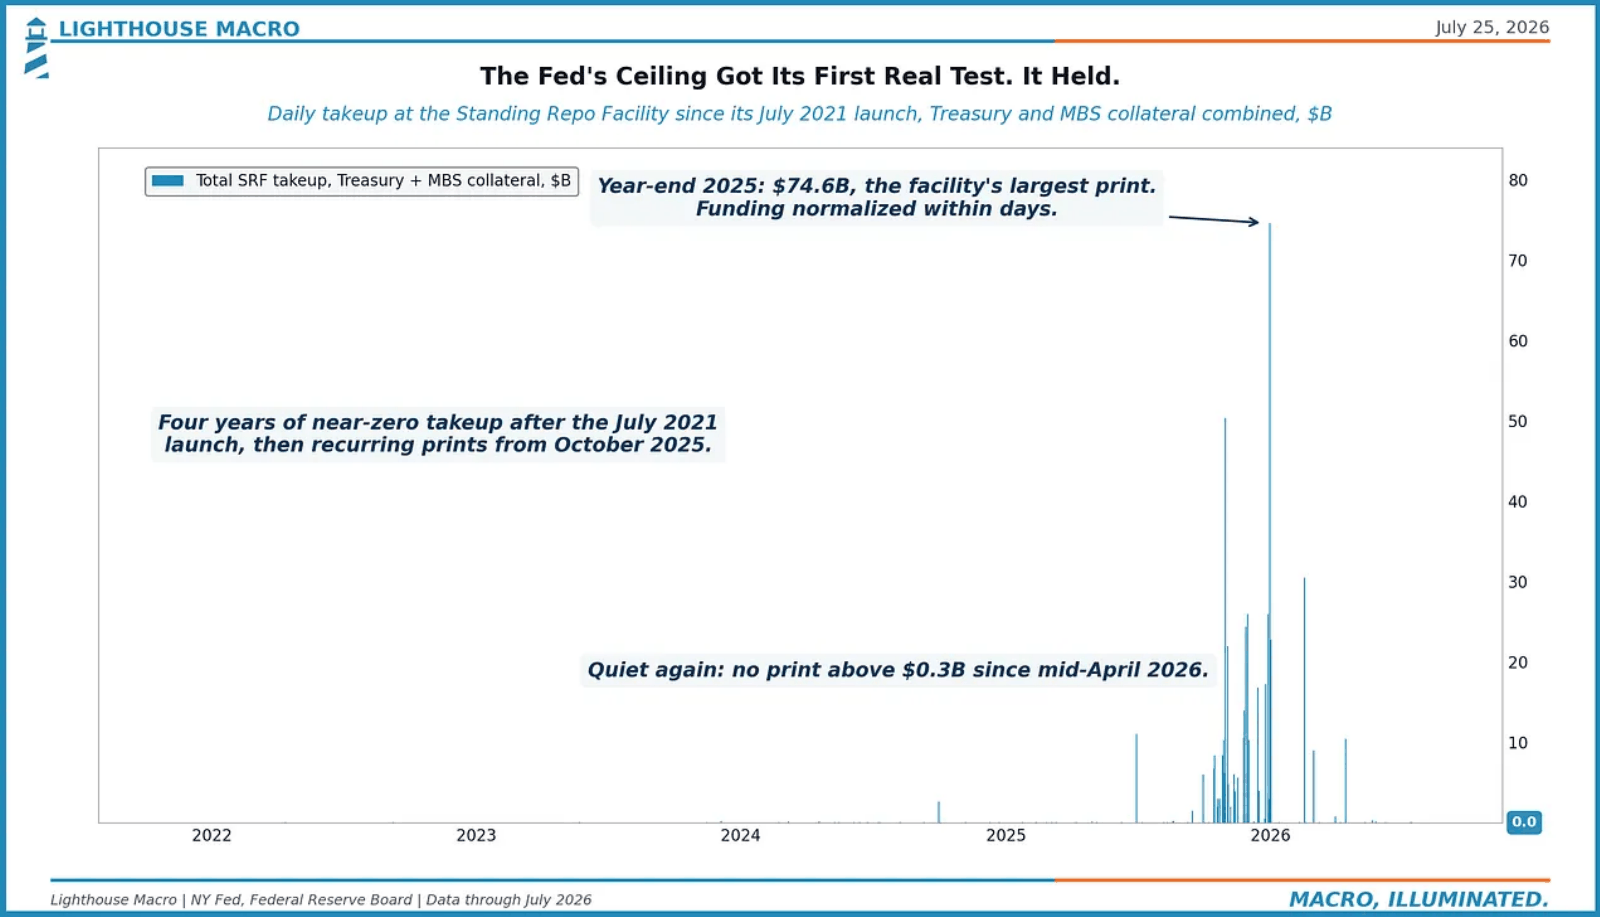
The ceiling, at least, has now been tested. The Standing Repo Facility ran four years with near-zero takeup. Year-end 2025 printed $74.6B, the facility’s largest, and funding normalized within days. Nothing above $0.3B since mid-April.
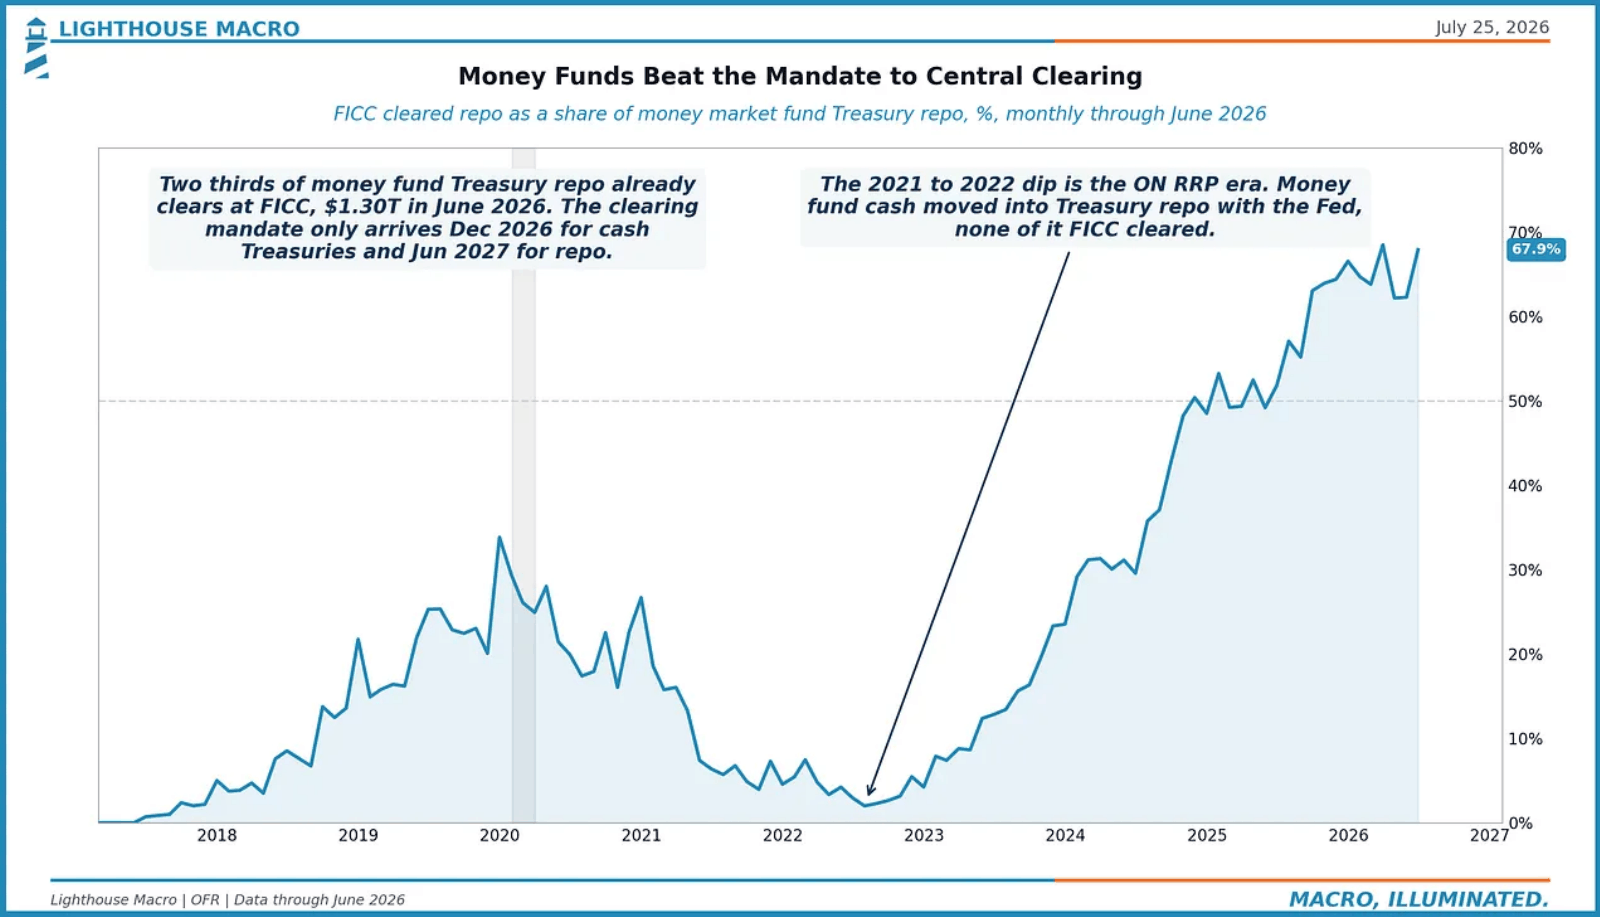
Market structure is moving faster than the rulebook. Two thirds of money fund Treasury repo already clears at FICC, $1.30T in June. The mandate does not arrive until December 2026 for cash Treasuries and June 2027 for repo. The market front-ran its own regulation.
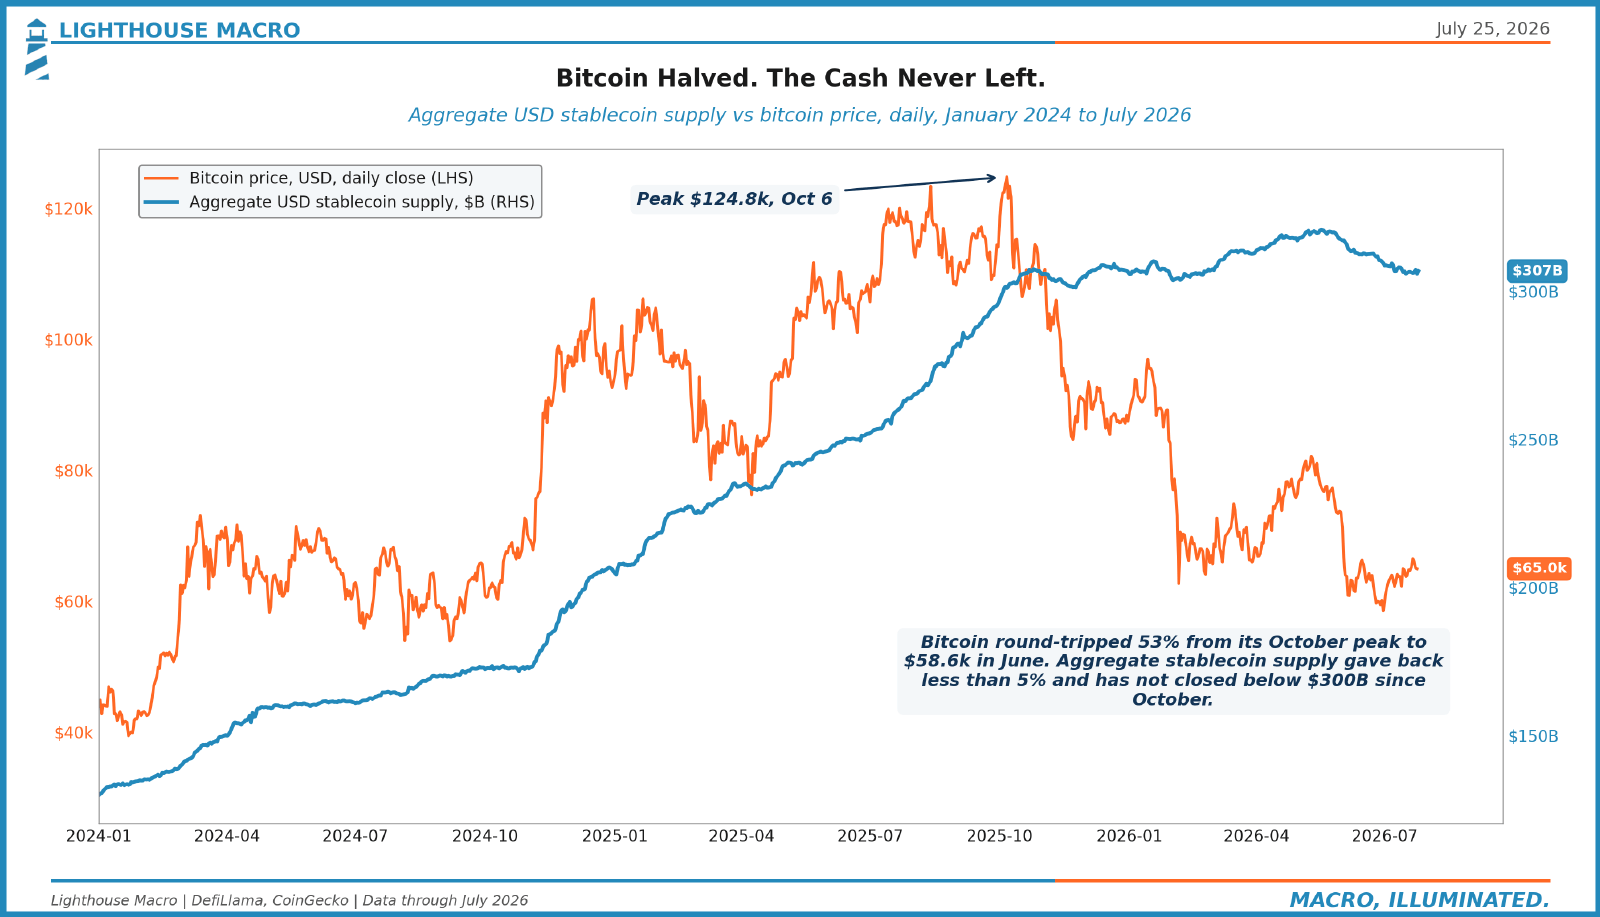
One more cash tell, from an unexpected corner. Bitcoin round-tripped 53% from its October peak to $58.6k in June. Aggregate stablecoin supply gave back less than 5% and has not closed below $300B since October.
06
Supply Is Not Slowing
None of this happened against light issuance.
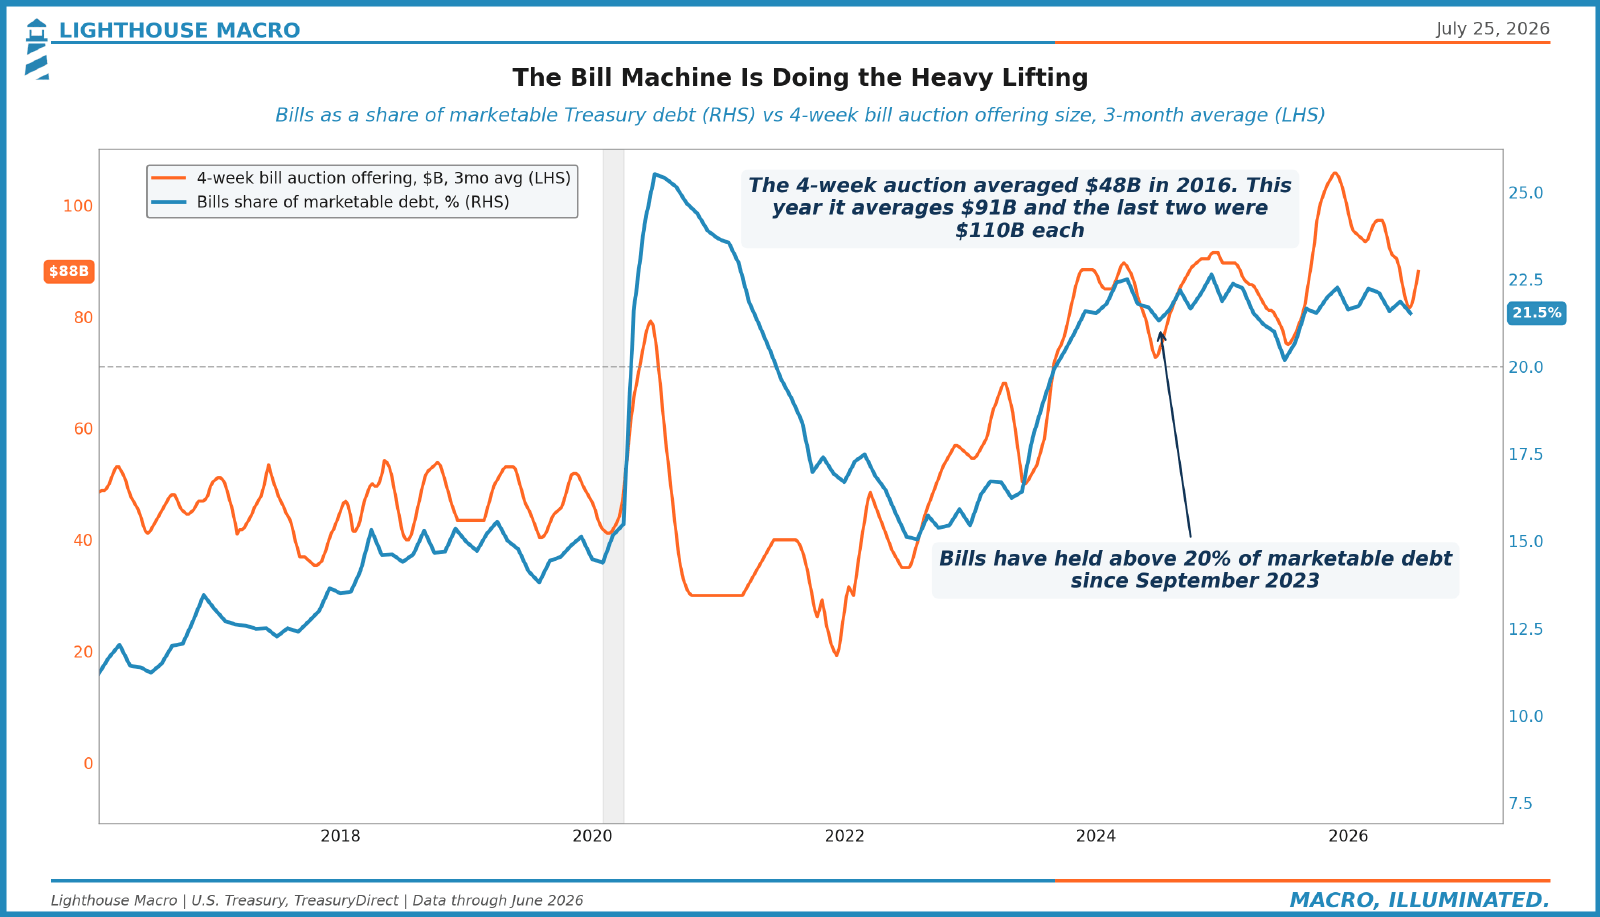
The 4-week bill auction averaged $48B in 2016. This year it averages $91B and the last two were $110B each. Bills have held above 20% of marketable debt since September 2023. The bill machine is doing the heavy lifting.
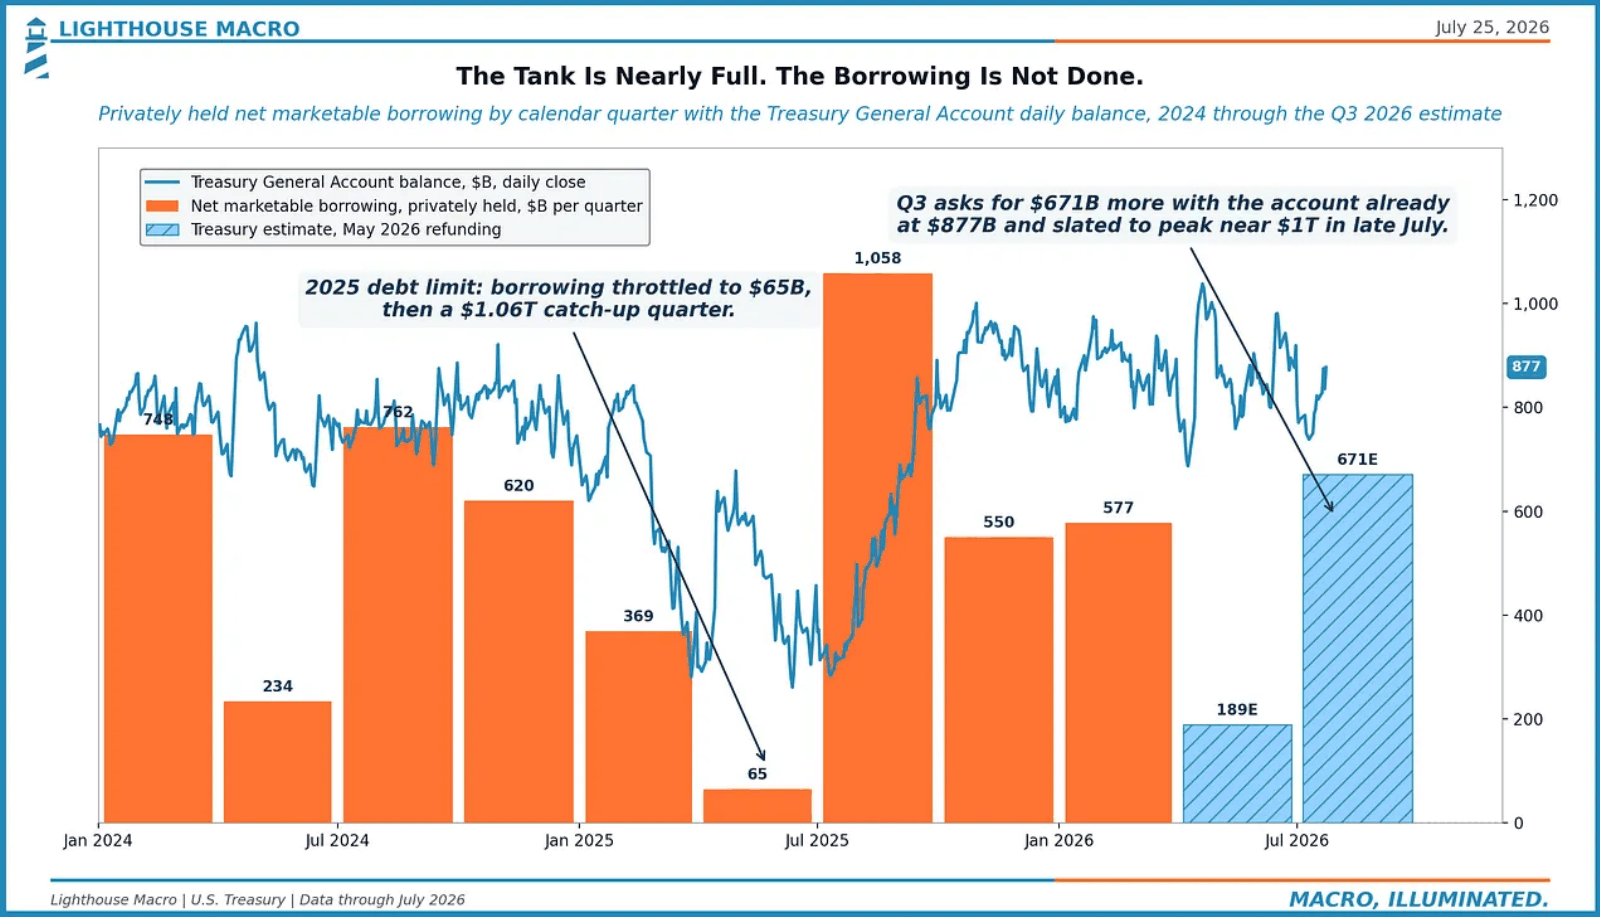
The TGA sits at $877B and is slated to peak near $1T in late July. Treasury still wants $671B of privately held net borrowing in Q3. The tank is nearly full. The borrowing is not done.
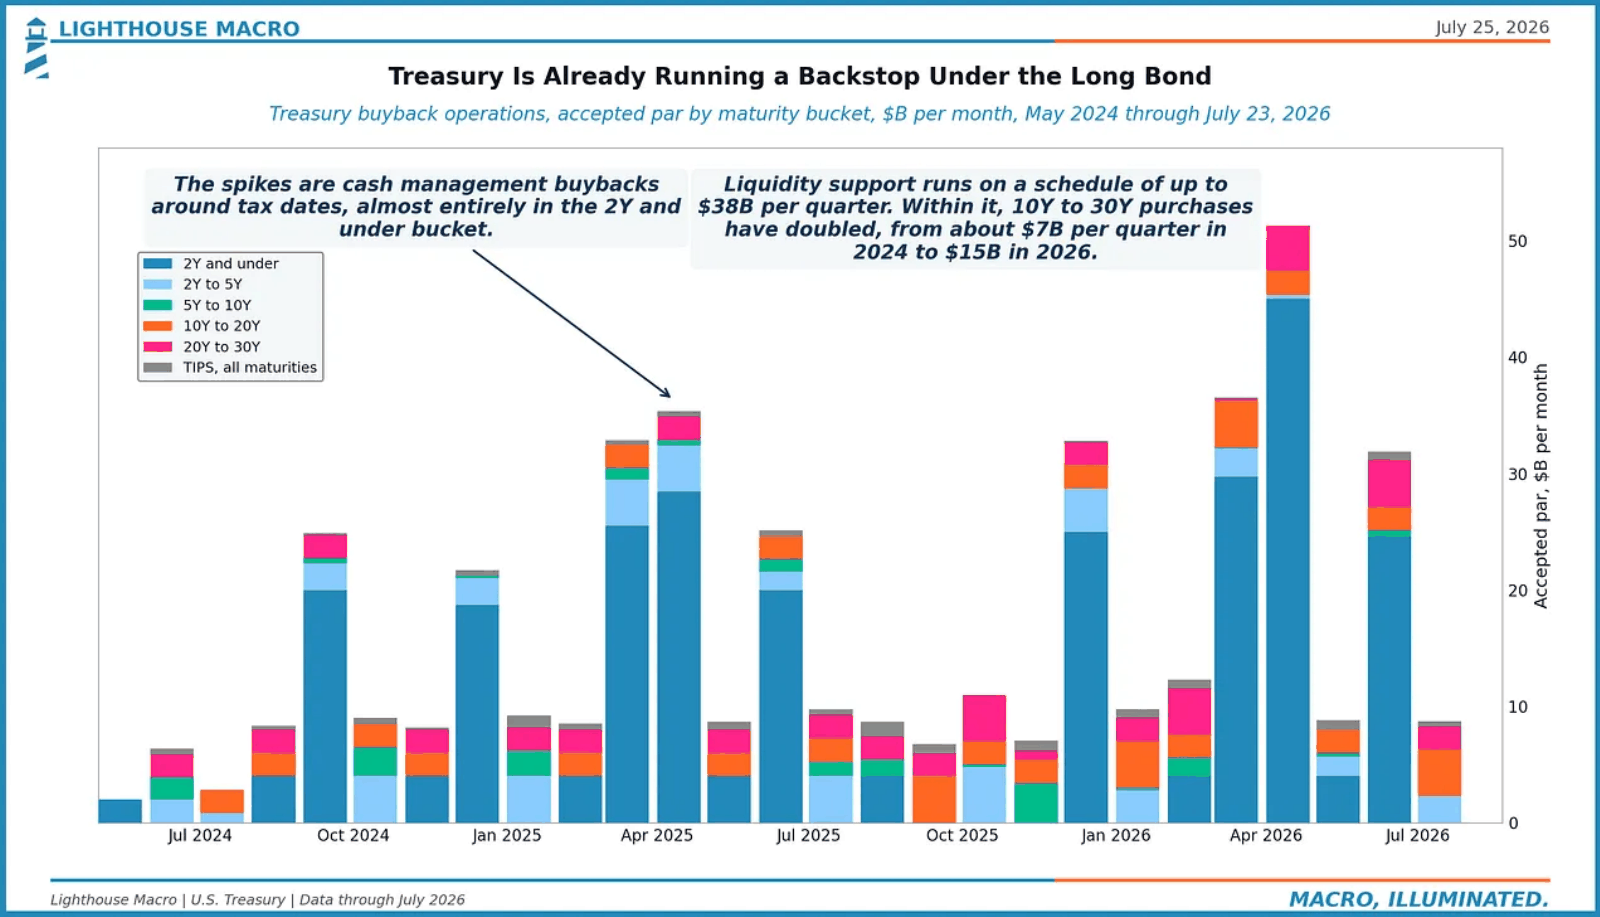
And Treasury is already running a backstop under the long bond. Liquidity support buybacks run on a schedule of up to $38B a quarter, and inside that envelope 10-year to 30-year purchases have doubled, from about $7B a quarter in 2024 to $15B now.
07
The Map
Put it together. The 5% long bond came back without a buyers’ strike, without a funding accident, and without the inflation anchor slipping. The selloff lives in the policy path. Auction demand bent toward our invalidation lines and did not break them. Official foreign money keeps leaving, private money keeps replacing it, and the levered bid that was supposed to be the fault line barely moved.
The pressure is real all the same. The slack under the floor is gone, reserves never rebuilt, coverage keeps drifting toward 2.30, and Q3 asks for another $671B with the account already near $1T. The FOMC meets next week. The refunding lands the week after. We will learn quickly whether the tape keeps telling the same story.
What would change our mind: a 3-auction bid-to-cover average through 2.30, dealer takedown pushing through 20%, funding stress that does not normalize in days, or long-end repricing that starts showing up in term premium instead of the path. None of those are on the tape today.